Insight & Analytics
What your visitors don't tell you, your destination now can.
Every interaction inside HypaMaps generates structured behavioural data that reveals how your destination is experienced, engaged with, and monetised.

The Behavioural Intelligence Engine
From engagement to insight.
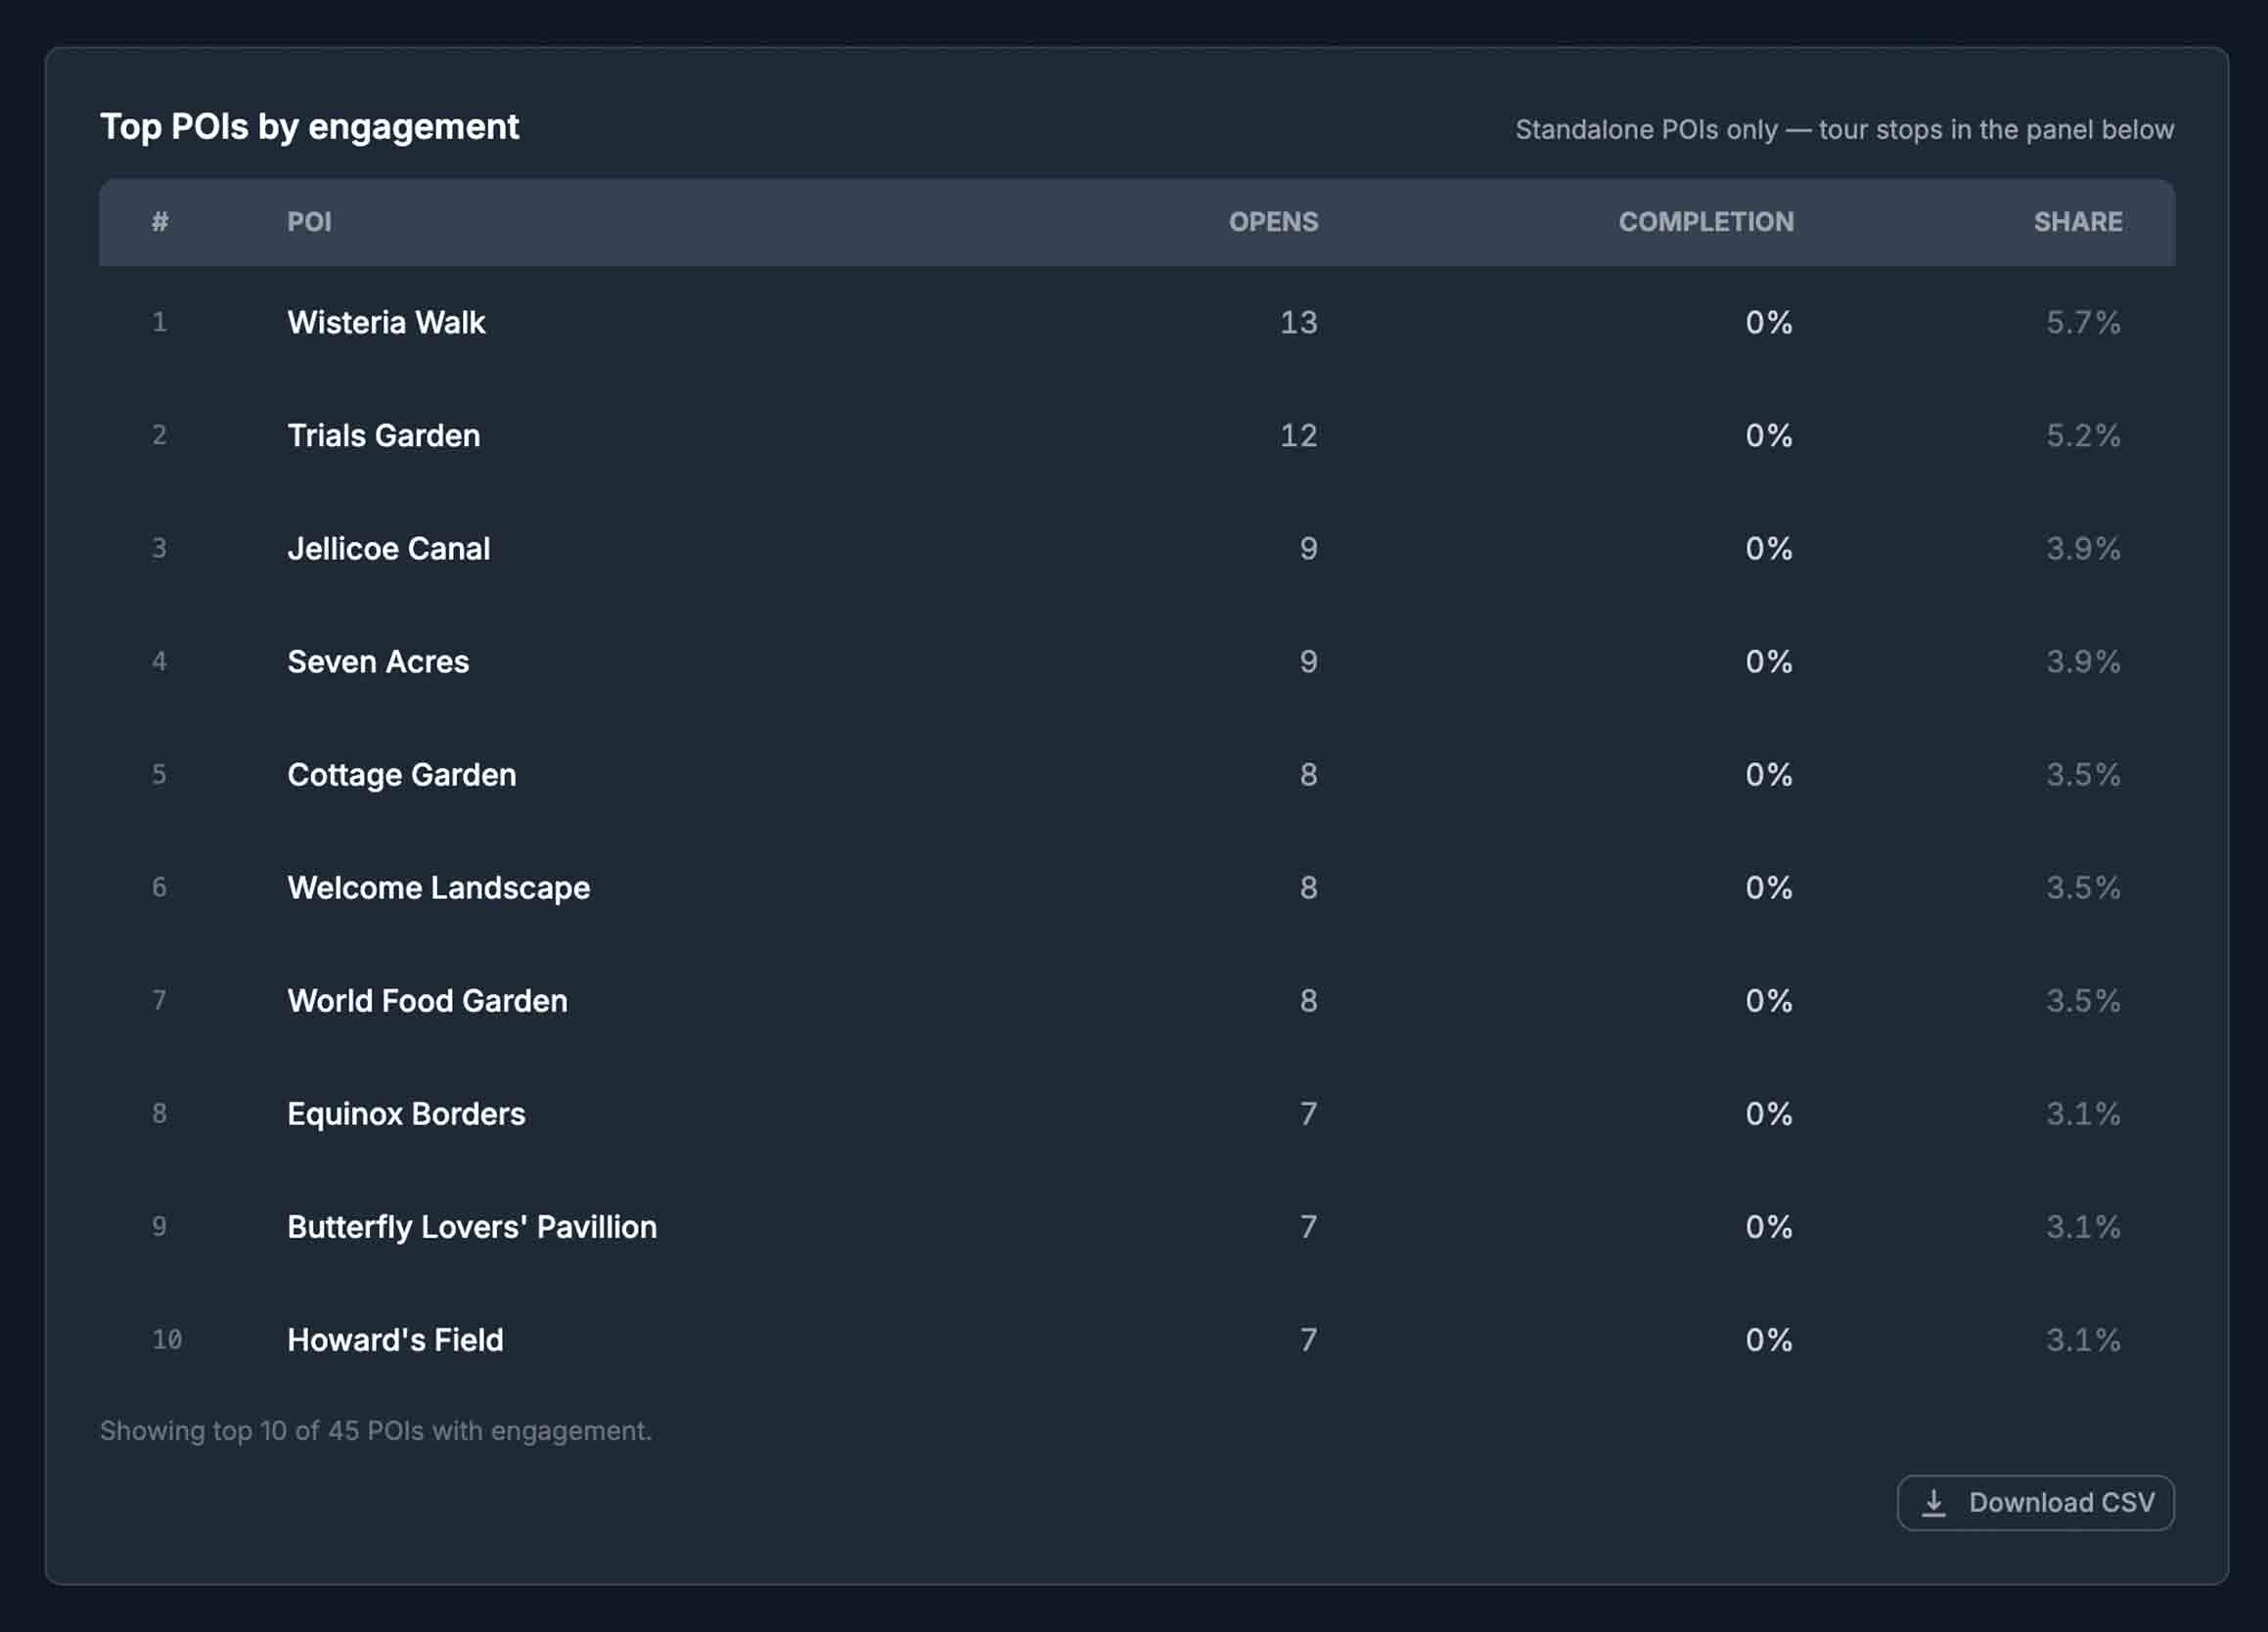
Every action a visitor takes in HypaMaps - every POI opened, route requested, link clicked, asset served - is logged, structured, and made available through your operator dashboard. Aggregated, this becomes a continuous behavioural feed for your destination. Filterable by time, zone, visitor segment, device, and source. Exportable to your own BI stack. Owned by you, not us.
Filter by hour · Compare day-on-day · Segment by source · Export to CSV, API, or BI

Behavioural Intelligence
Behavioural Intelligence
Captured
every interaction logged
Structured
enriched · aggregated · queryable
Exportable
dashboard · CSV · API · BI
Four signal types
Every operational question your destination produces, finally answered
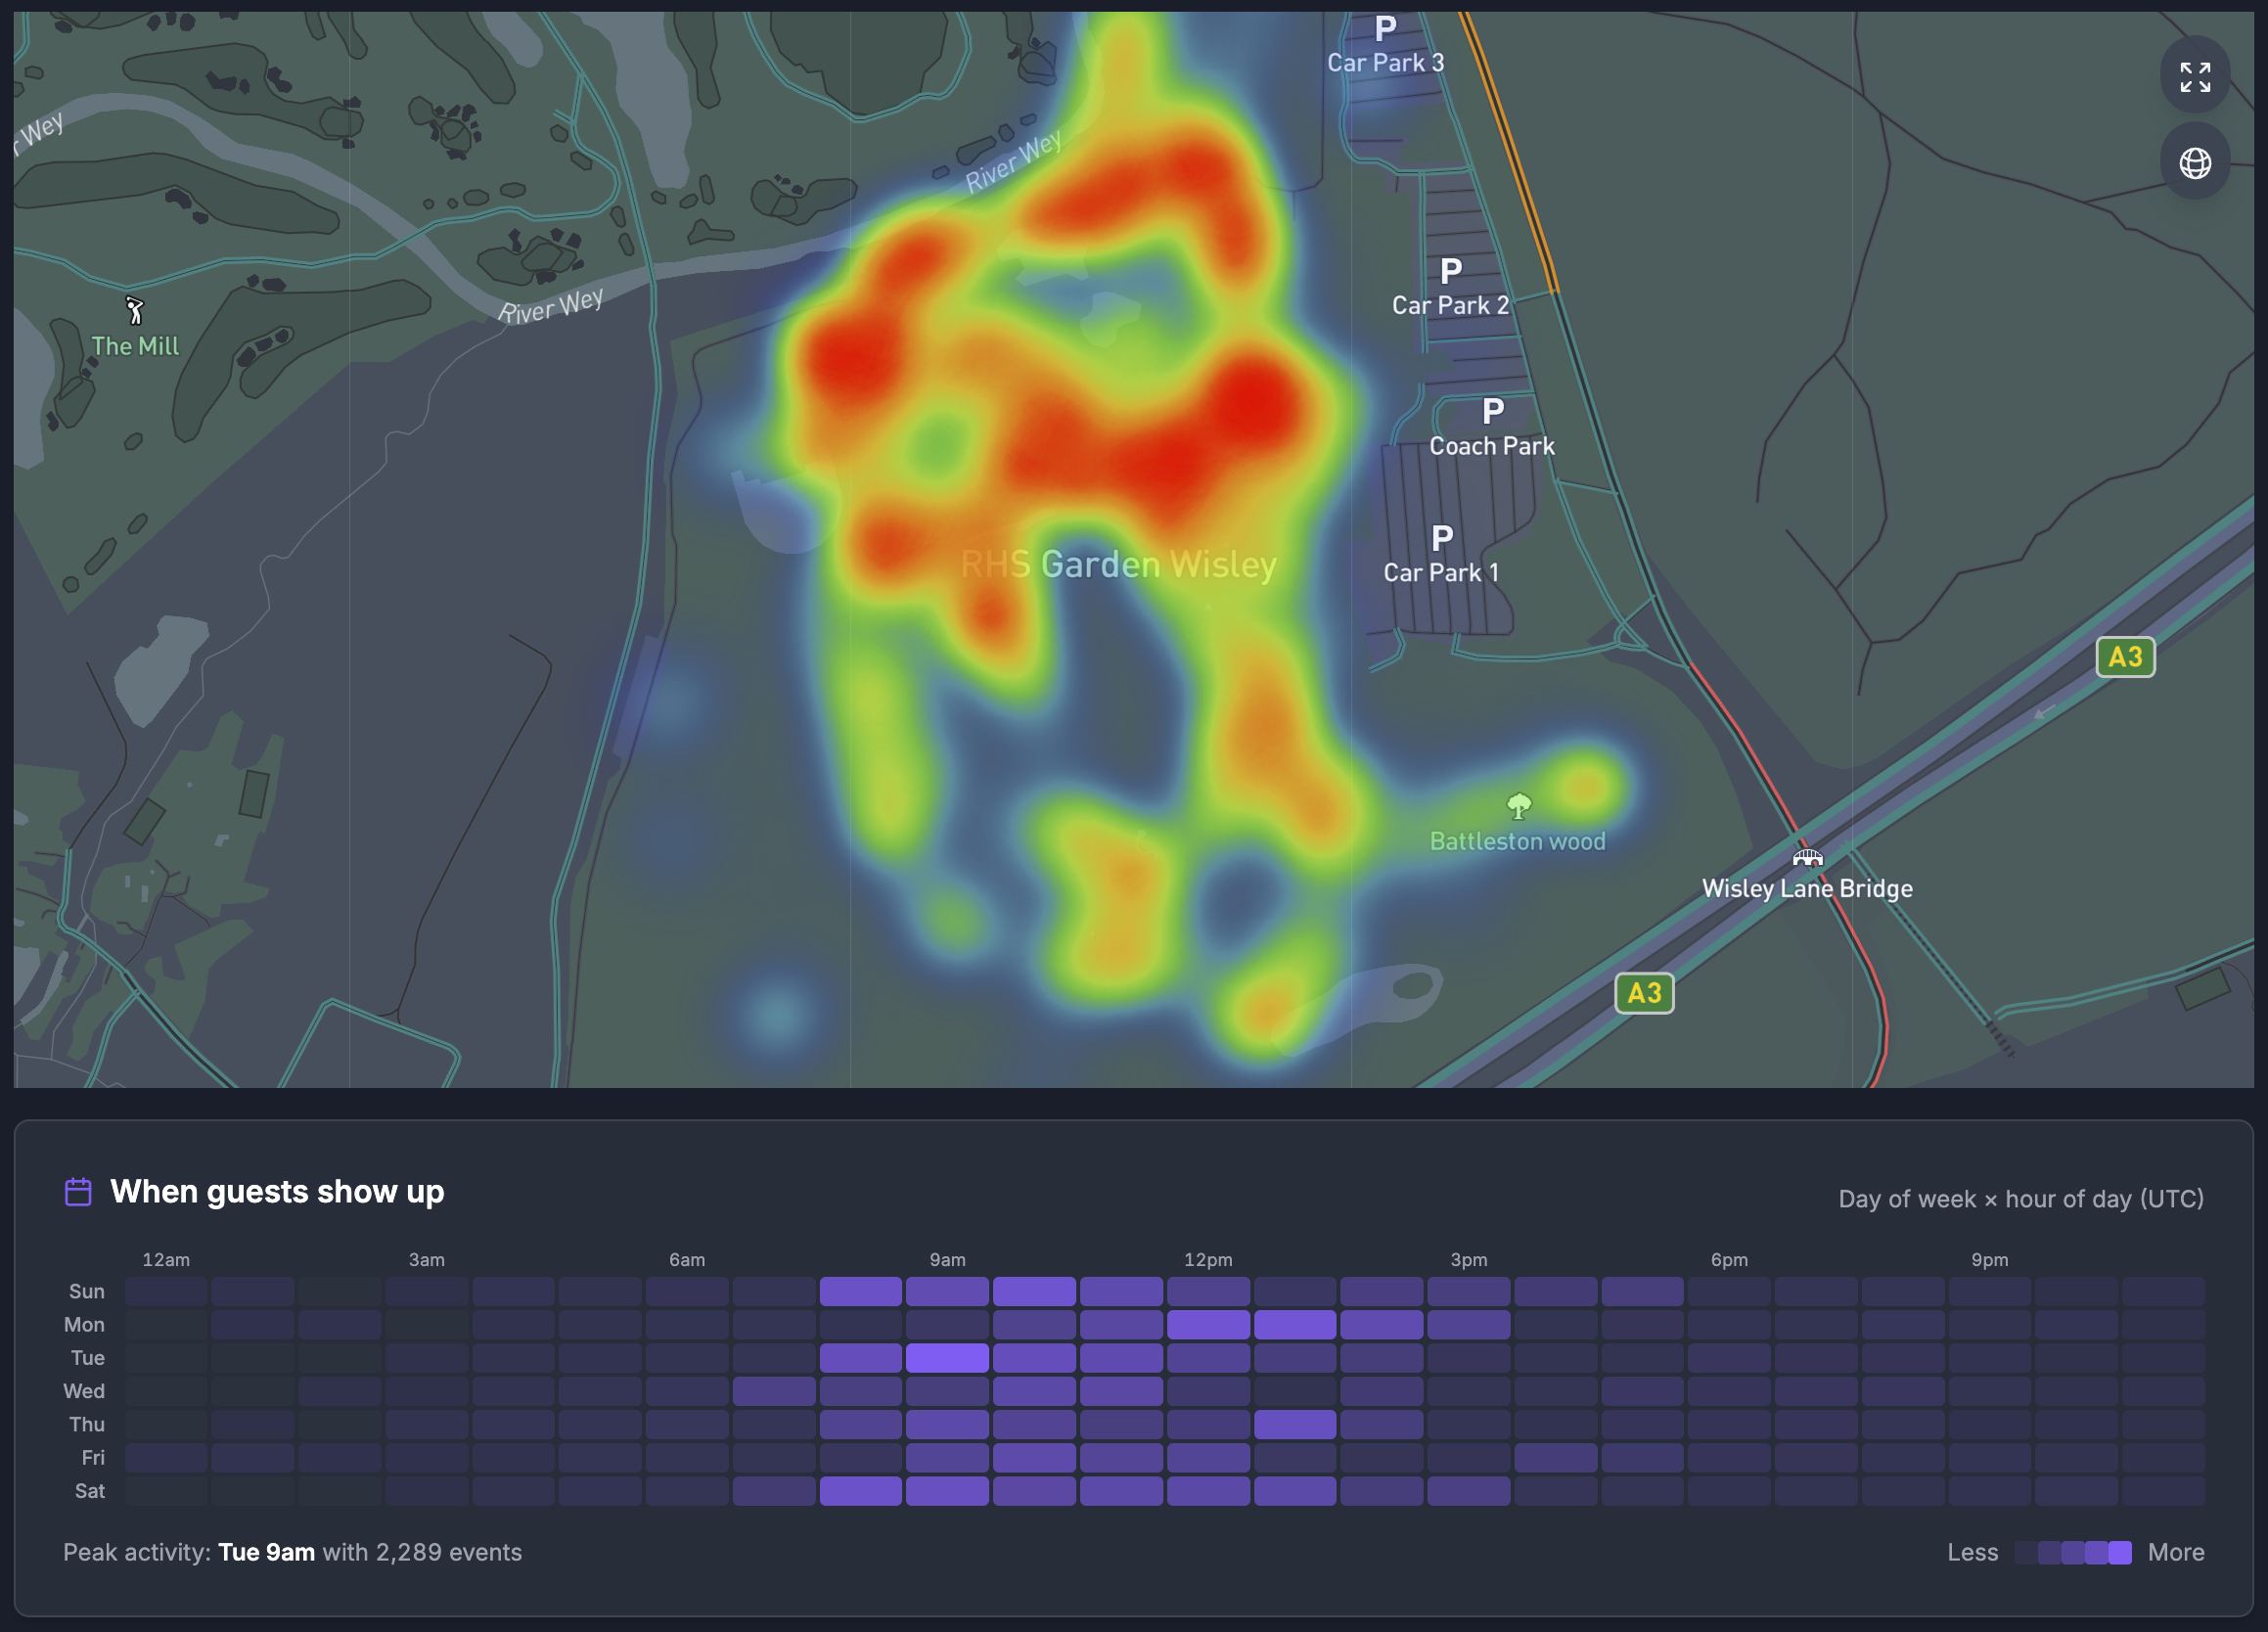
Movement & dwell
See exactly where visitors congregate, where they pass through, and where they linger; by hour, by day, by zone.
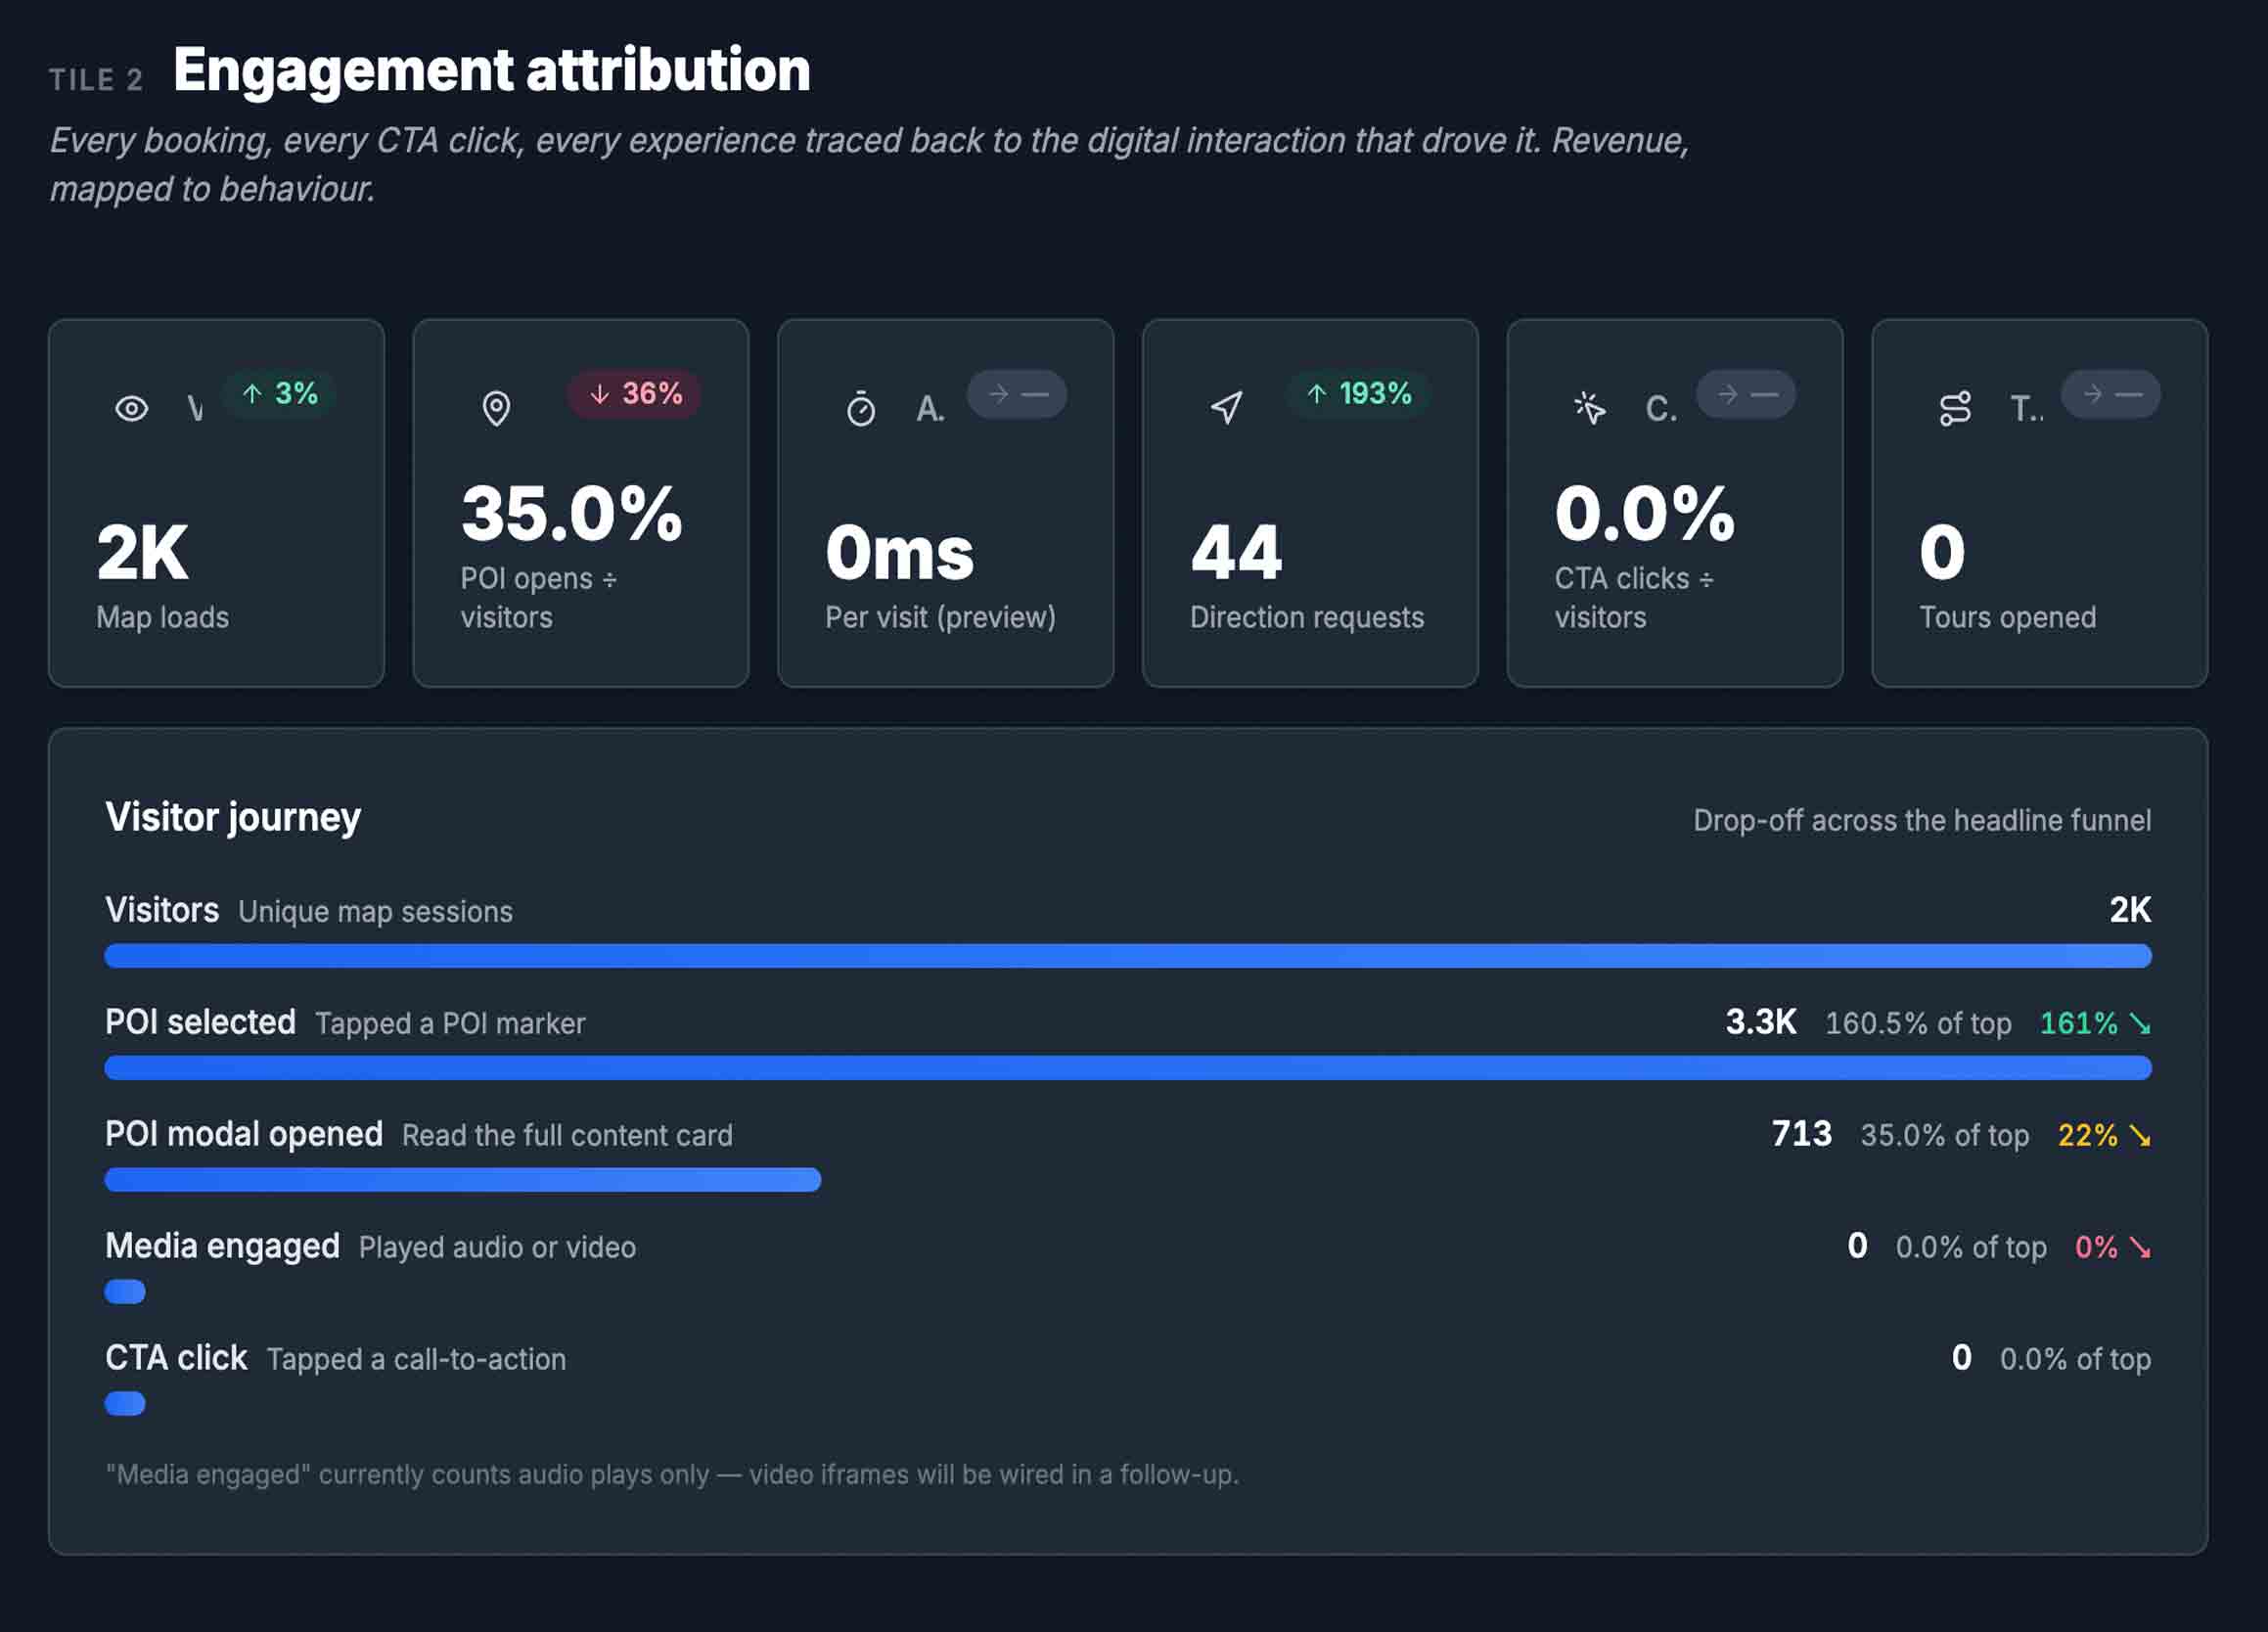
Engagement attribution
Every booking, every CTA click, every experience traced back to the digital interaction that drove it. Revenue, mapped to behaviour.
Operational visibility
Congestion points, drop-off zones, under-used assets; surfaced as data, not anecdote. Brief your teams on what's actually happening.
Marketing intelligence
Which experiences your visitors actually care about, which campaigns convert, which POIs earn attention. Decisions, not impressions.
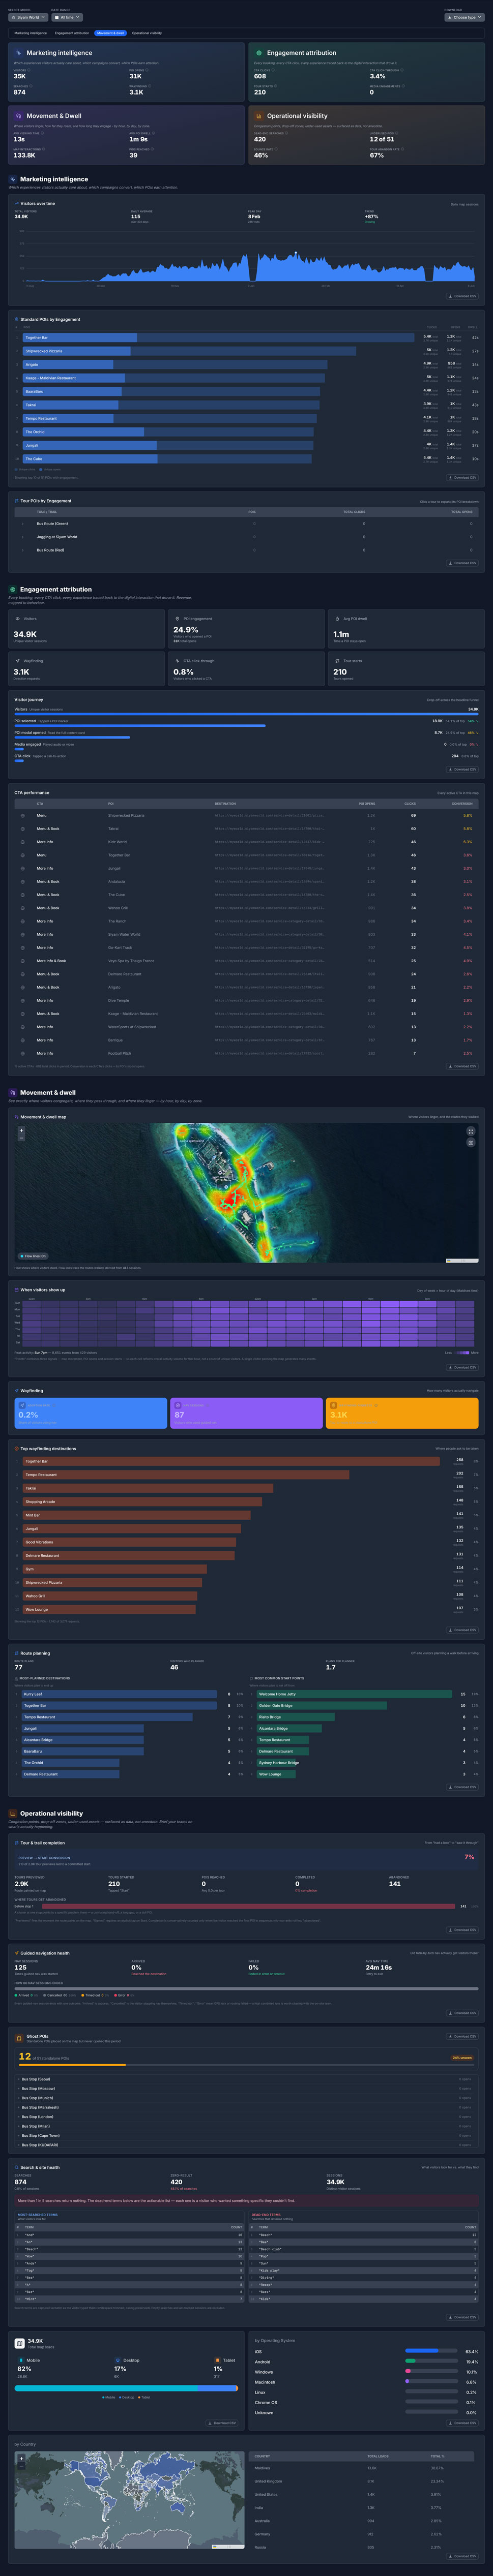
The analytics dashboard
A dashboard built for the people making the decisions.
Every department in your operation benefits from a different slice of the same data. The HypaMaps analytics dashboard makes those slices accessible without an analyst, a data team, or a custom report.
Marketing pulls campaign attribution. Operations pull hourly footfall. Commercial pulls POI conversion data. Interpretation pulls story engagement. The data is one feed. The views are tailored to who's looking.
Decisions this unlocks
Data is the product. Decisions are the proof
Behavioural intelligence is only as valuable as the operational decisions it changes. Five examples, drawn from live HypaMaps deployments.
- 1
Move staff to the zones where visitors actually congregate at 11am - not where you assume they do.
- 2
Promote the spa treatment that 3,200 visitors viewed but only 41 booked. The demand is real; the funnel is broken.
- 3
Reduce signage spend on the path nobody walks - and double it on the route visitors are choosing instead.
- 4
Brief F&B based on yesterday's actual footfall pattern, not last year's seasonal average.
- 5
Show your owners and board a measurable, attributed link between digital engagement and on-property revenue.
Open data
Your destination's data, owned by you.
HypaMaps is your data infrastructure, not your data gatekeeper. Every metric in the platform is exportable - CSV, API, scheduled reports, direct integration with your BI stack. Your destination's behavioural data is your asset; we just make it visible.
HypaMaps
your data
CSV download
REST API
Scheduled email
BI tools
Looker · Tableau · Power BI compatible
On the desk
See your destination's behavioural data on a real dashboard, in 20 minutes
A 20-minute demo. Your property, real data, real decisions.