By Department
Different teams. Different decisions. One platform.
HypaMaps gives every department in your destination the data and tooling that improves the decisions they're already making.
Find your role. See your data. Book a tailored call.

Department 01
Marketing
Drives awareness, demand, and brand perception across digital channels.
What you can't see
- ·Which destination facilities prospective visitors explored before booking - and which they ignored entirely
- ·The actual conversion path from a campaign click to an on-property experience booking
- ·How your destination is rendered to the world on Google Maps - outdated satellite imagery quietly undermining your brand for years
HypaMaps provides
- →An embeddable, photorealistic interactive map on your website and booking journey
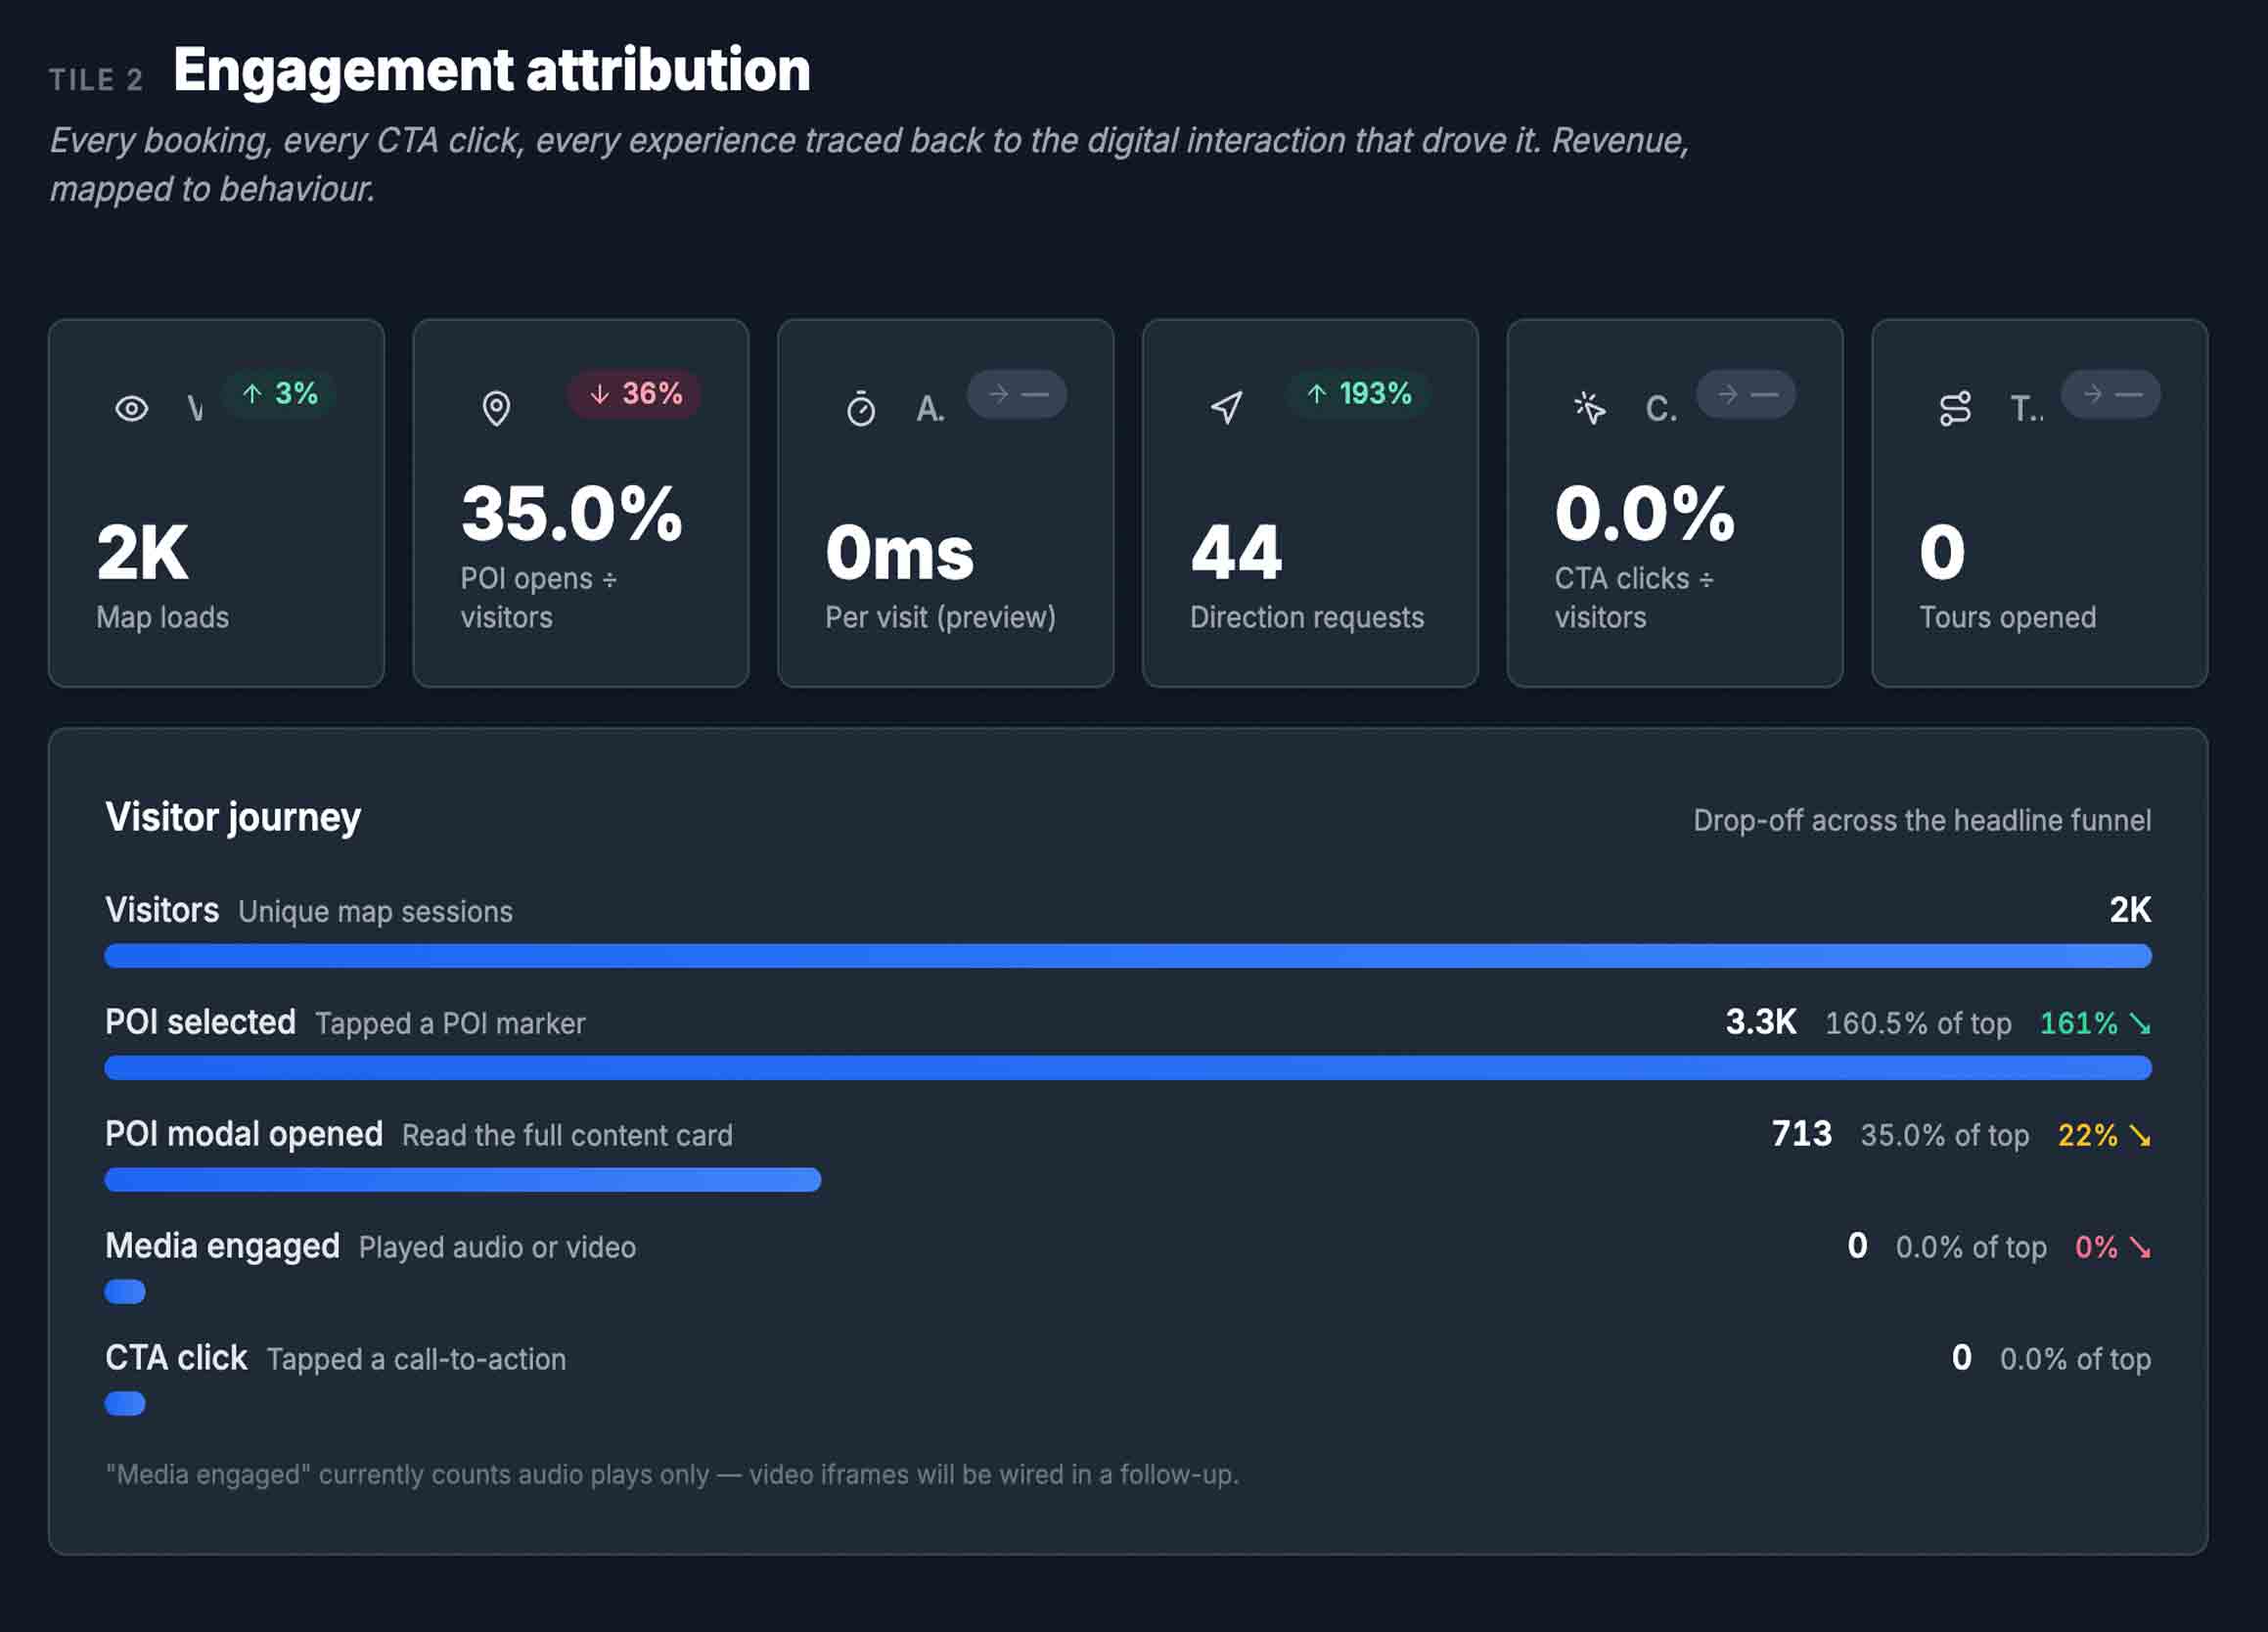
- →Per-POI engagement attribution - every CTA click traceable to its source, time, and digital interaction
- →Accelerated Google Maps imagery refresh as part of HypaMaps' Content Partner status
Decisions this improves
- ★Where to spend campaign budget - based on which experiences pre-arrival visitors are actually researching
- ★Which experiences to feature in editorial, social, and paid - based on real engagement, not internal favourites
- ★How to measure marketing's contribution to on-property revenue - with attribution data, not estimation
Department 02
Operations
Owns the day-to-day delivery of visitor experience, on-property.
What you can't see
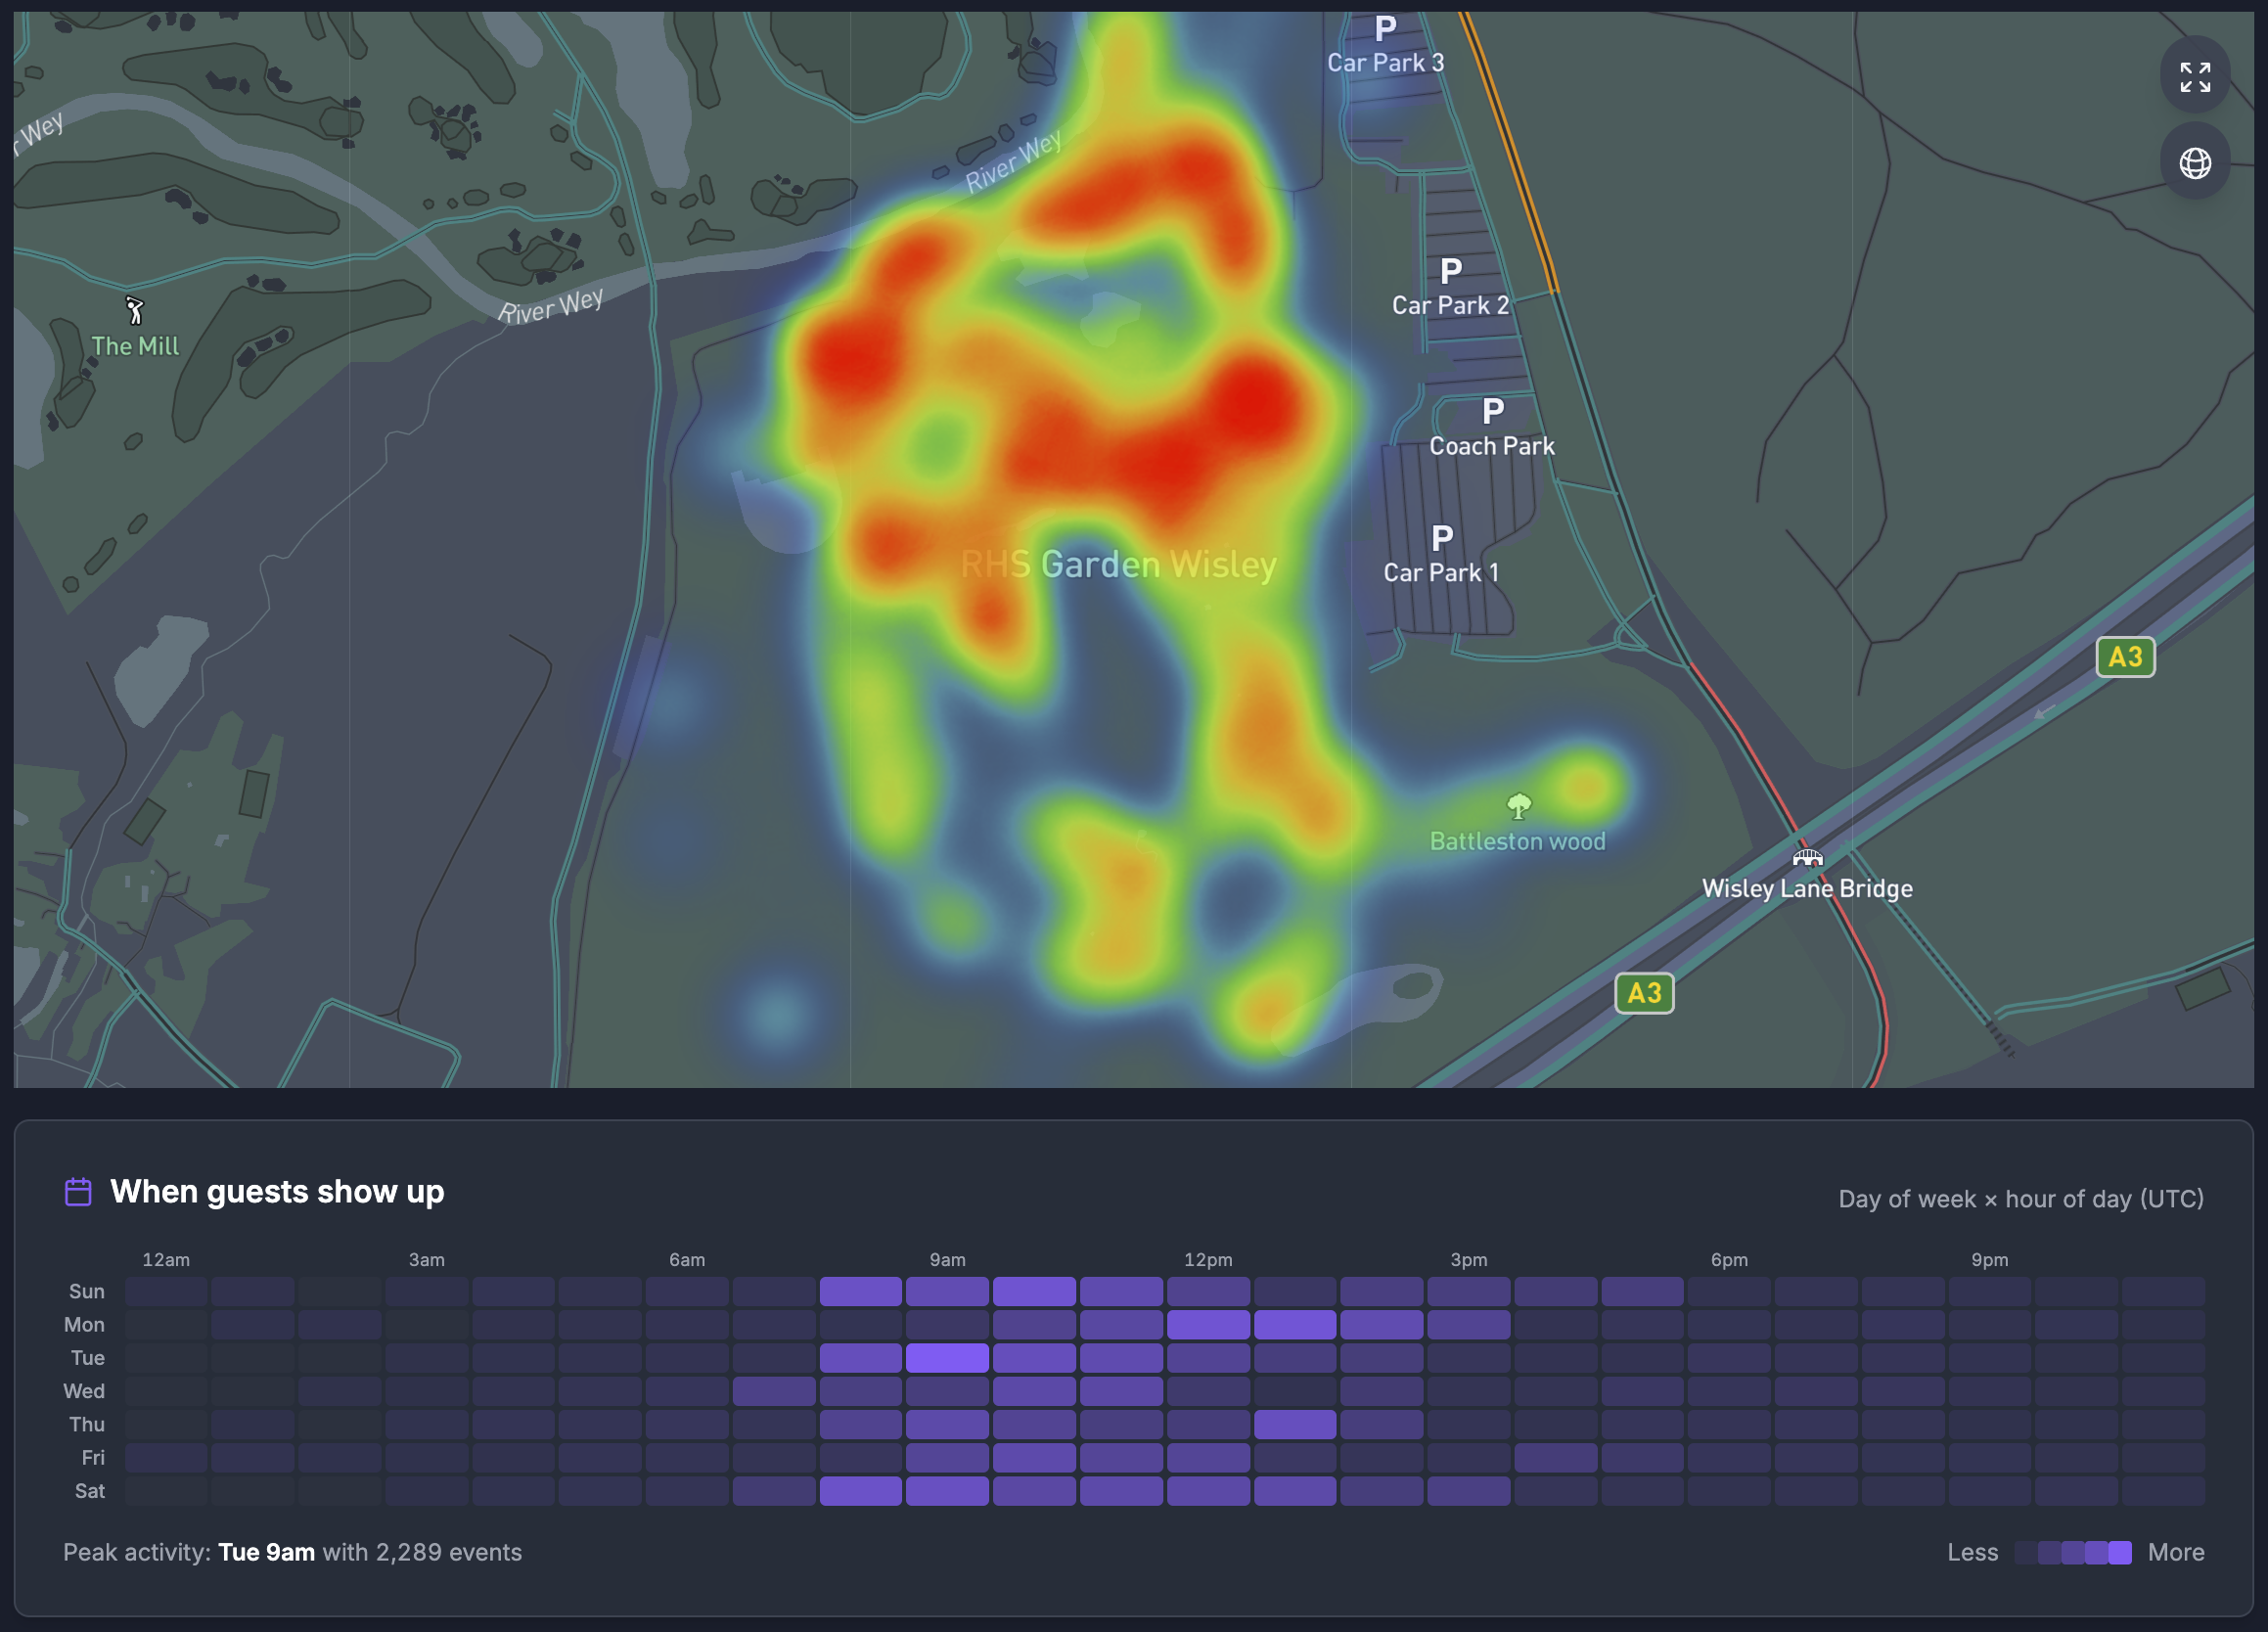
- ·Where and when visitors congregate on a normal Tuesday vs. a peak Saturday
- ·Which paths visitors actually take across your property - and which signed routes they ignore
- ·Where the bottlenecks form, by hour, before they become visitor complaints
HypaMaps provides
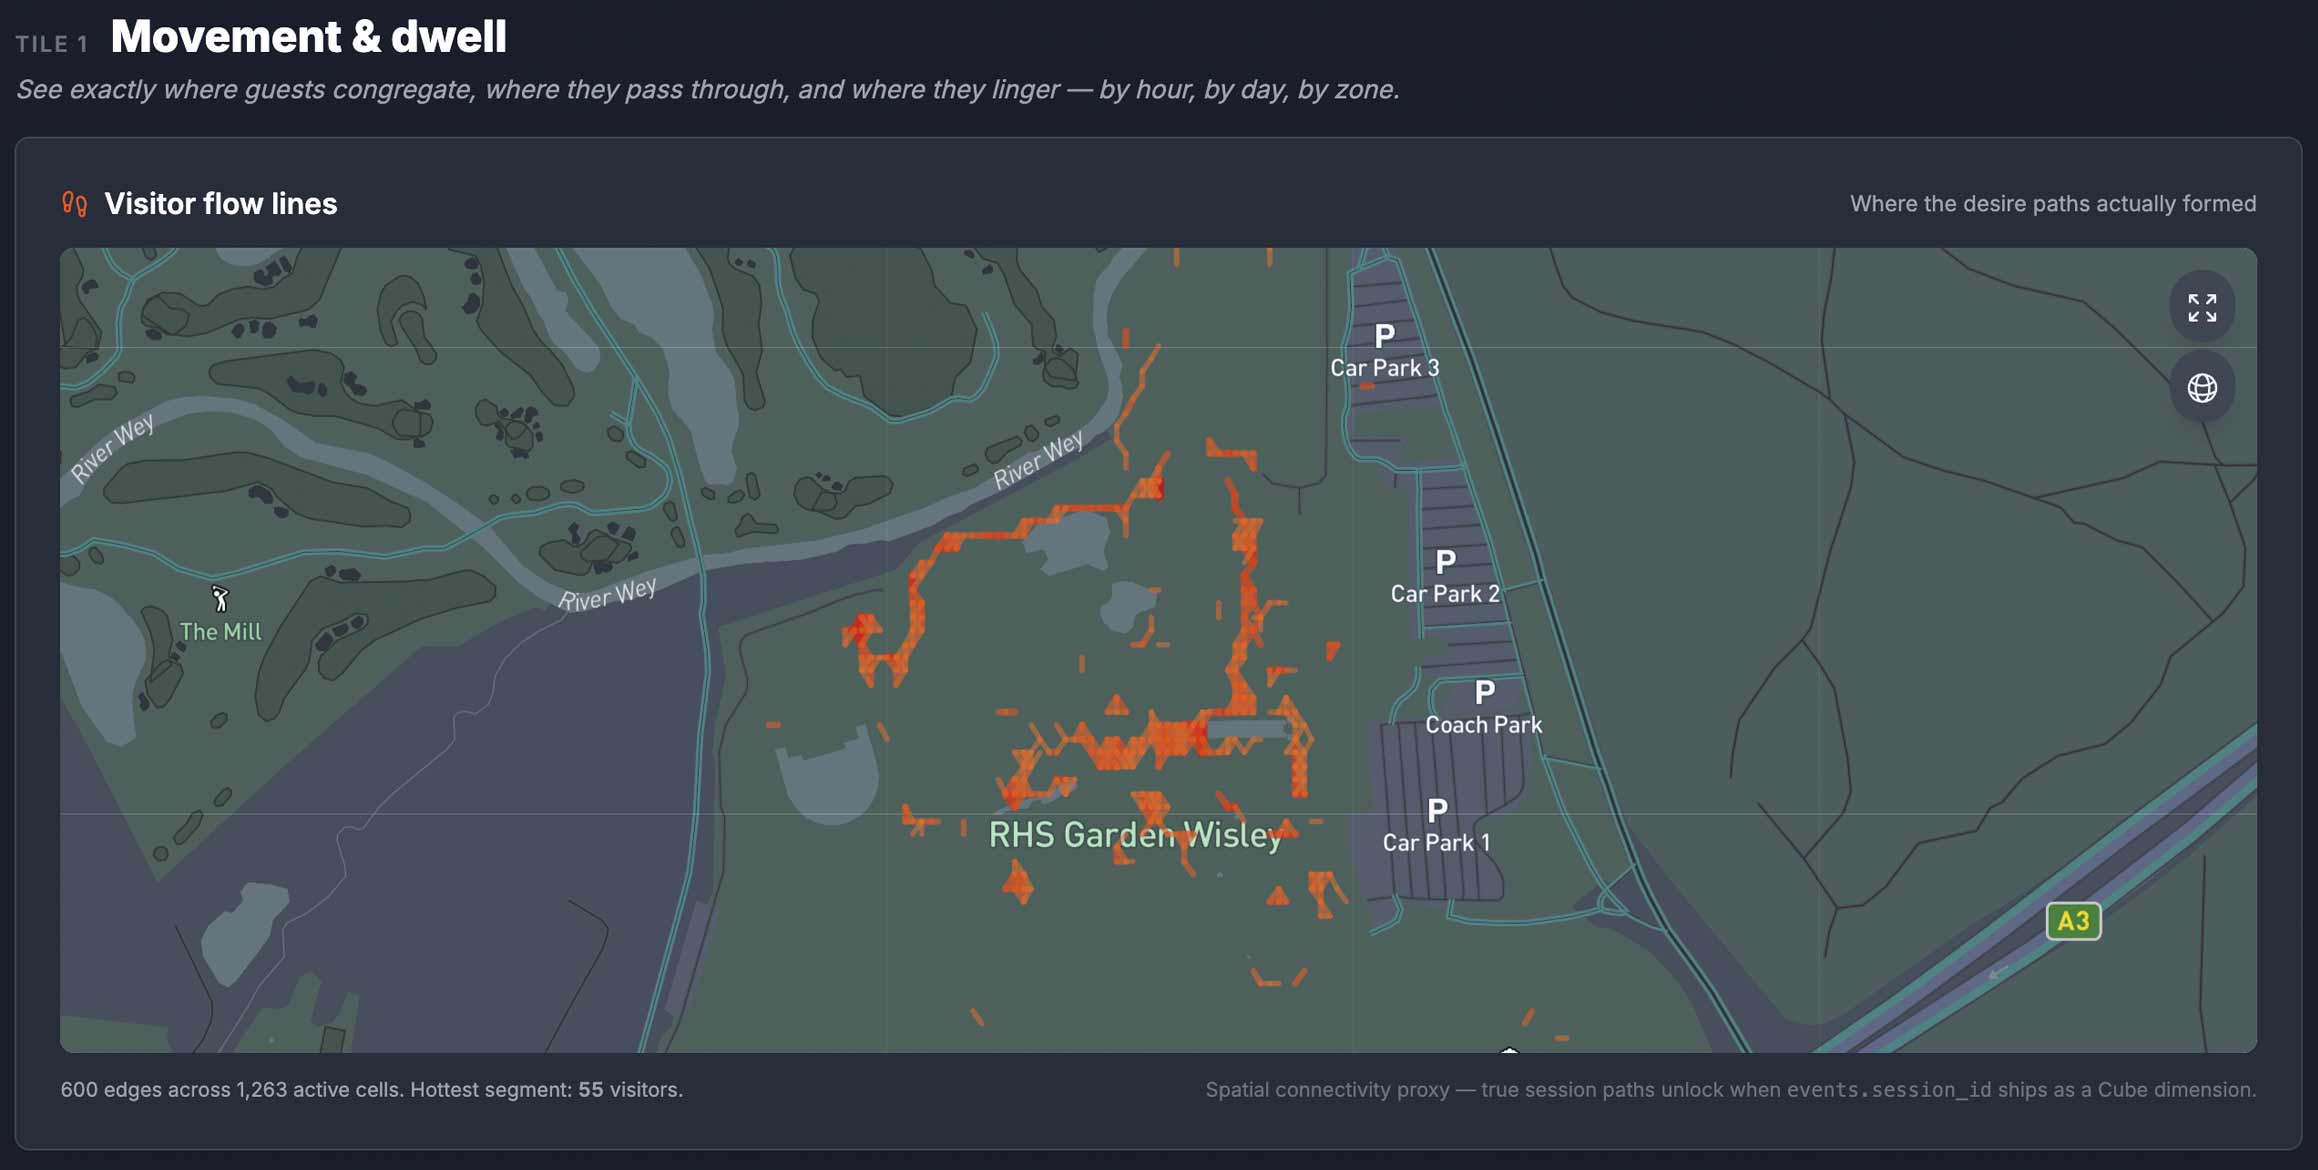
- →Live and historic footfall heatmaps, filterable by day-part, season, and visitor segment
- →Path and flow visualisation - the actual routes visitors choose, not the routes you mapped
- →Congestion and dwell-time data, aggregated by zone
Decisions this improves
- ★Where to deploy staff at 11am - based on yesterday's actual footfall pattern, not the rota's assumption
- ★Which signage to add, remove, or relocate - based on routes visitors are actually choosing
- ★When to open or close zones, increase capacity, or reroute - backed by hourly behavioural data
Department 03
Commercial / Revenue
Owns on-property revenue performance - F&B, retail, experiences, ancillaries.
What you can't see
- ·Which experiences are generating digital interest but failing to convert to bookings
- ·Which POIs are attracting attention but underperforming on revenue per visitor
- ·Where pricing, packaging, or positioning needs to change - based on engagement signal, not gut
HypaMaps provides
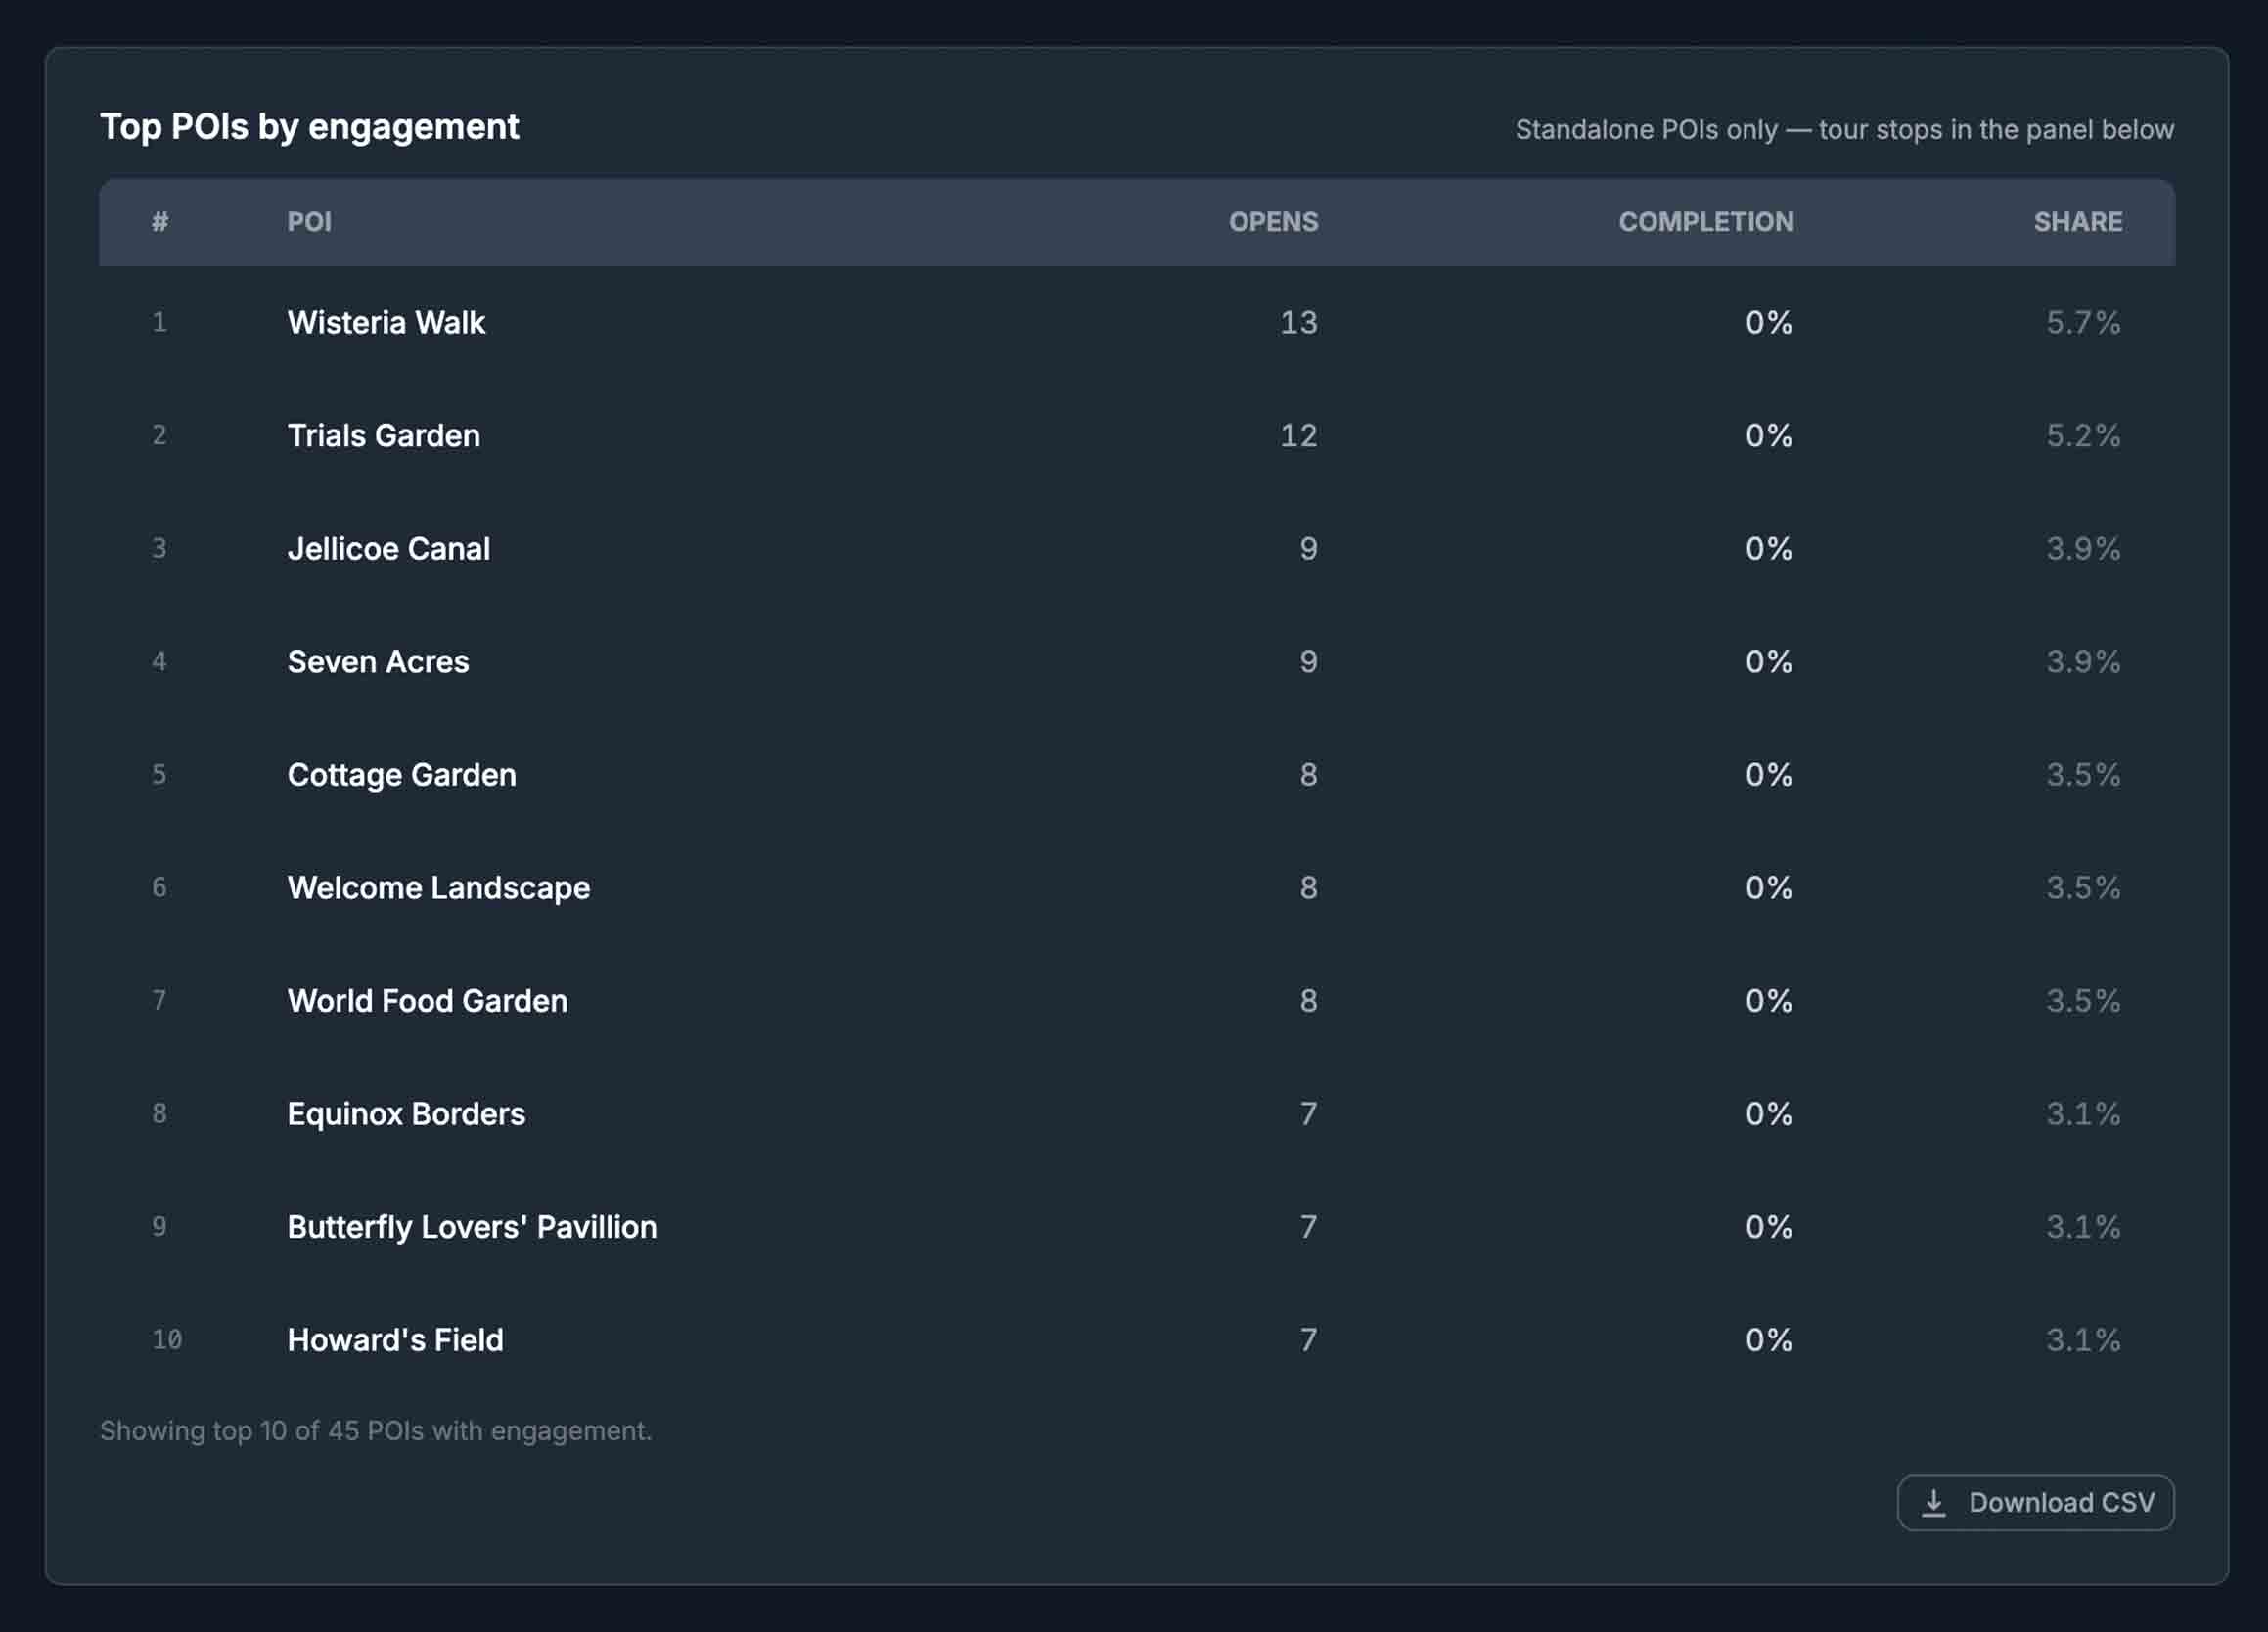
- →POI engagement leaderboards ranked by views, clicks, and conversion rate
- →Revenue attribution - every booking traced to the digital interaction that drove it
- →Demand-vs-supply visibility per experience, per zone, per time-of-day
Decisions this improves
- ★Which experiences to invest in scaling - based on demand evidence, not internal advocacy
- ★Which underperforming POIs need a pricing, copy, or imagery rework - surfaced by engagement-to-booking gap
- ★How to package and cross-sell - informed by actual co-engagement patterns between POIs
Department 04
Visitor Experience
Owns the visitor's emotional and practical journey from pre-arrival through post-departure.
What you can't see
- ·Where visitors get lost, confused, or frustrated - before they fill out a survey
- ·Which accessibility-flagged routes are actually used - and where accessibility is silently failing
- ·The pre-arrival readiness of your visitors - how much they've explored and understood before check-in
HypaMaps provides
- →Pre-arrival exploration analytics - what visitors looked at, returned to, and engaged with before they arrived
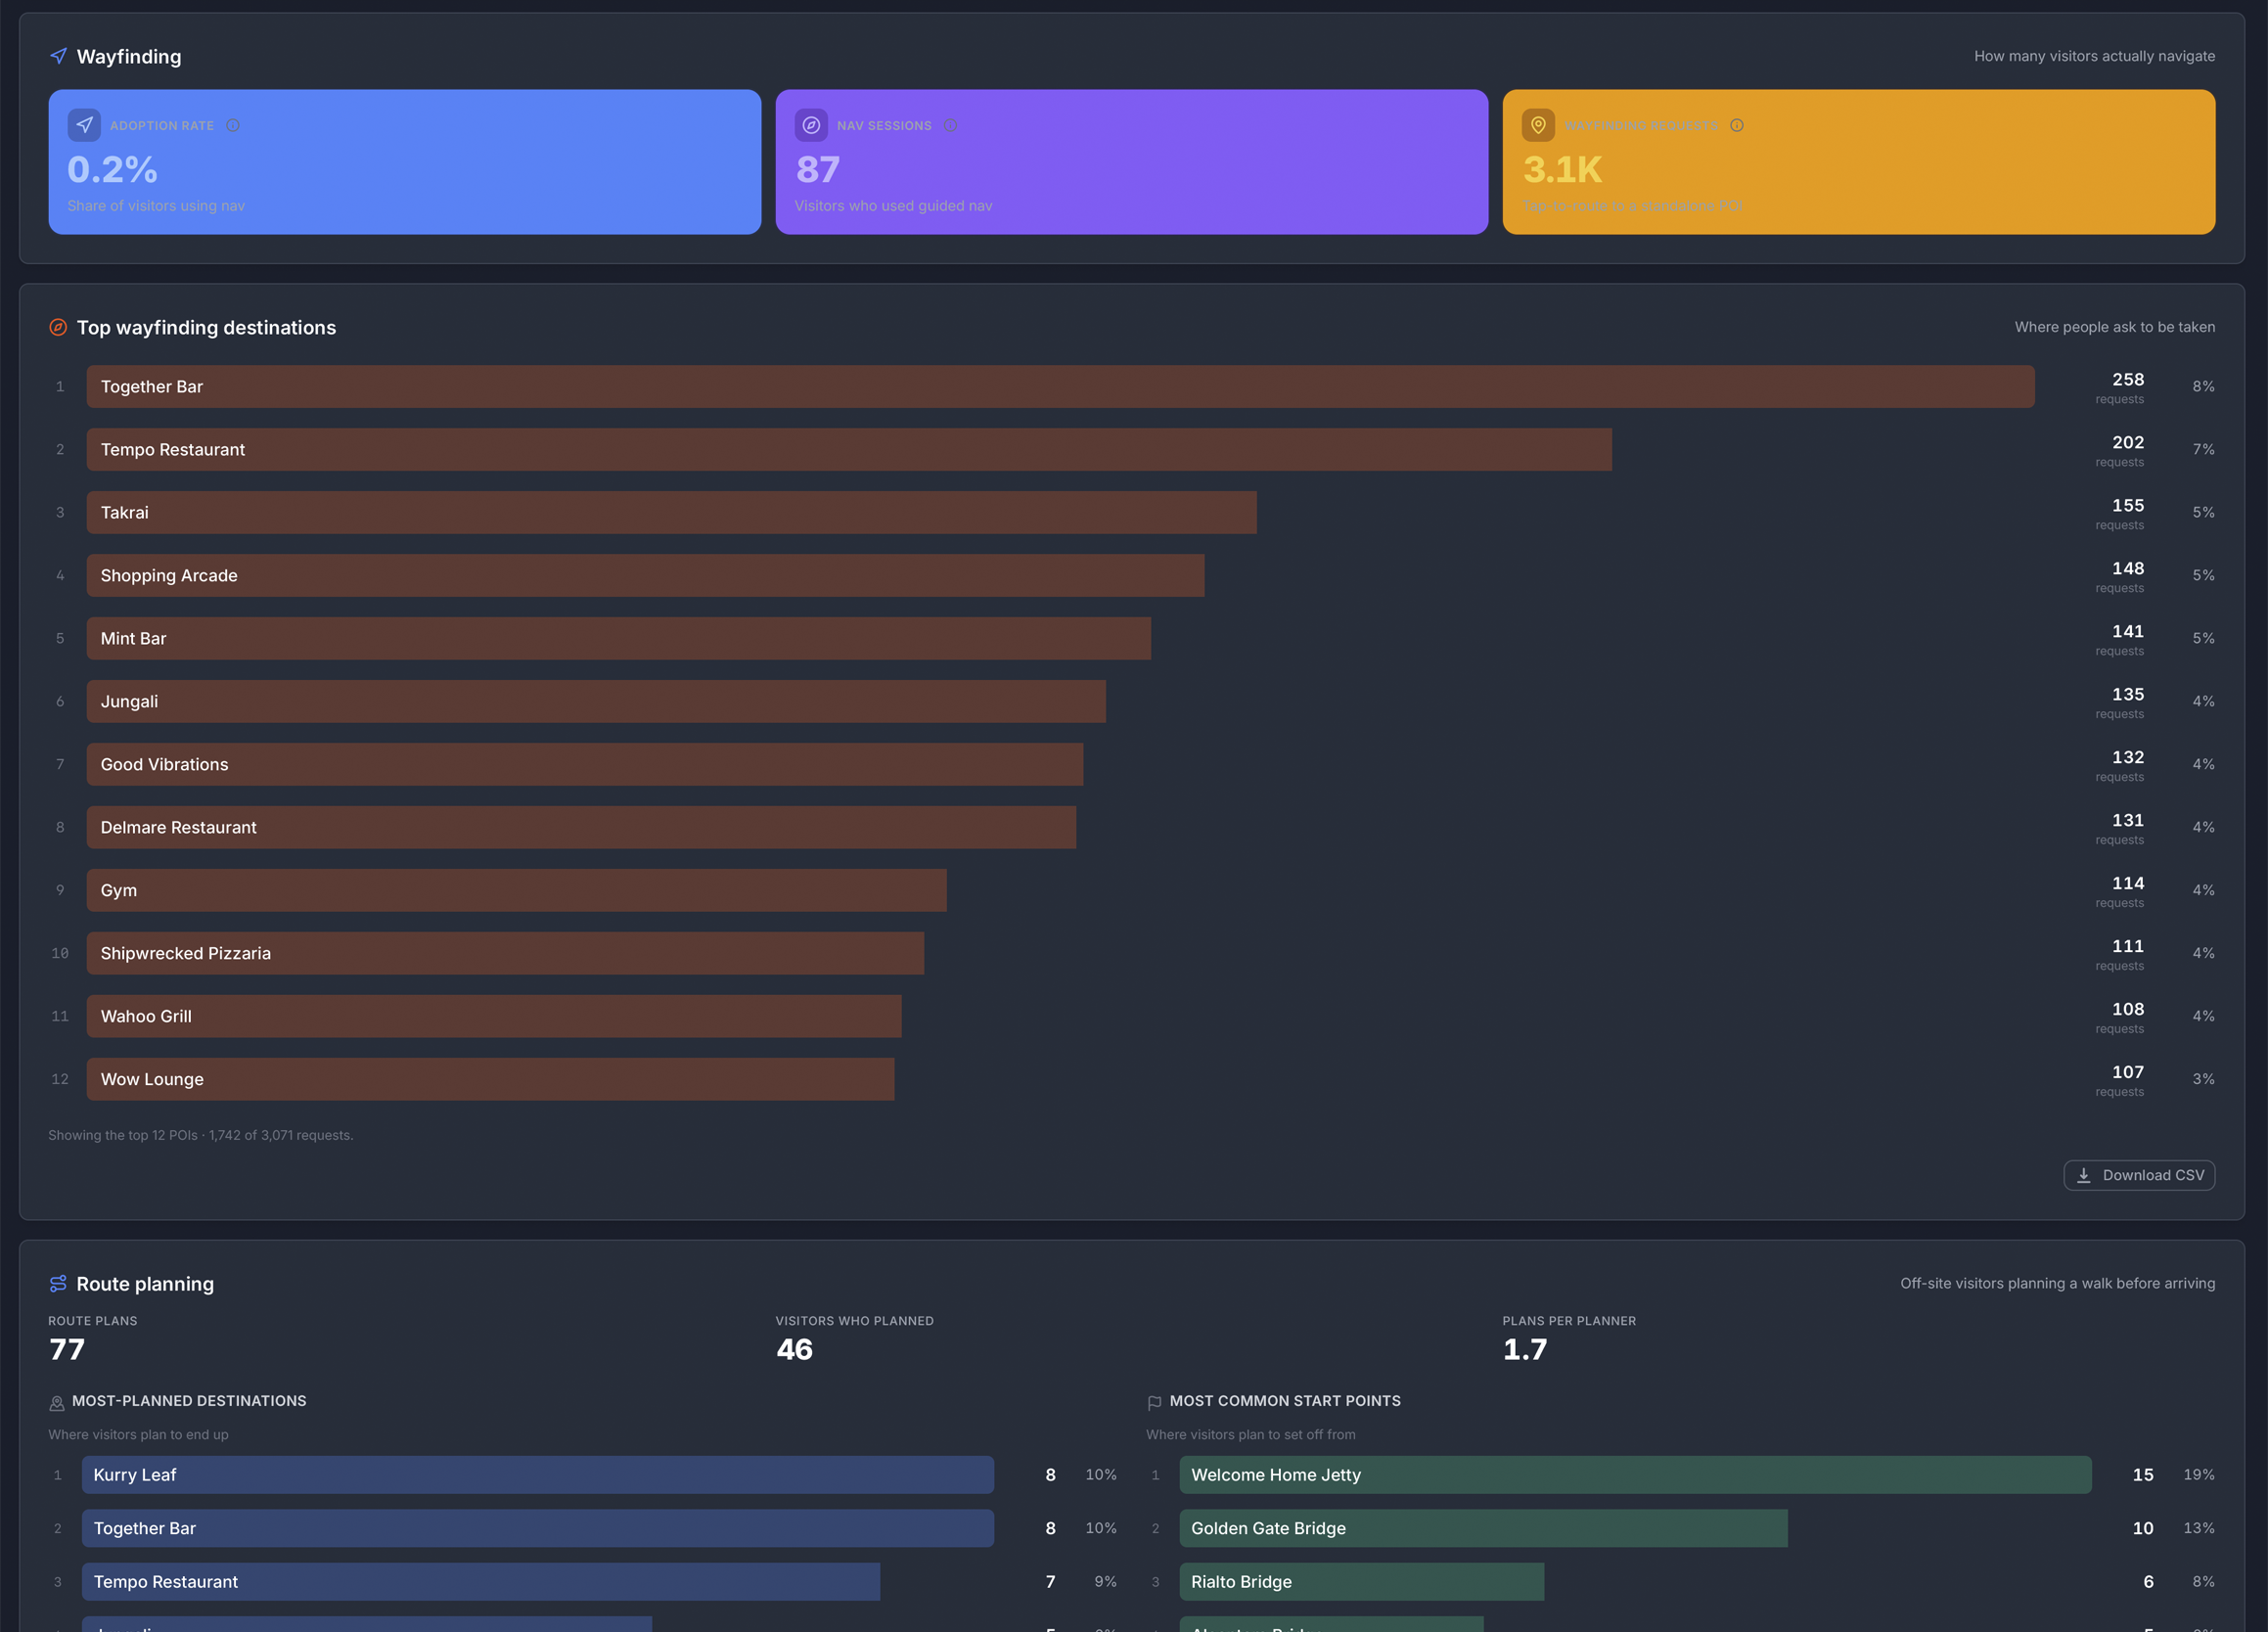
- →Wayfinding success and failure data - where routes get abandoned, restarted, or redirected
- →Accessibility route usage data - which adapted paths are used, and which need extending
Decisions this improves
- ★Where to add wayfinding interventions - physical signage, app prompts, staff presence - based on actual confusion data
- ★How to brief check-in staff - informed by what each visitor researched before arriving
- ★Which accessibility provisions to invest in - backed by usage evidence, not assumption
Department 05
Interpretation
Owns the narrative, educational, and cultural layer of the visitor experience - across signage, panels, audio, guides, and digital storytelling.
What you can't see
- ·Which interpretive content visitors actually engage with - and which is walked past
- ·How long visitors dwell at narrative nodes vs. skipping straight through
- ·Whether the story arc you've designed is the story arc visitors are actually following
HypaMaps provides
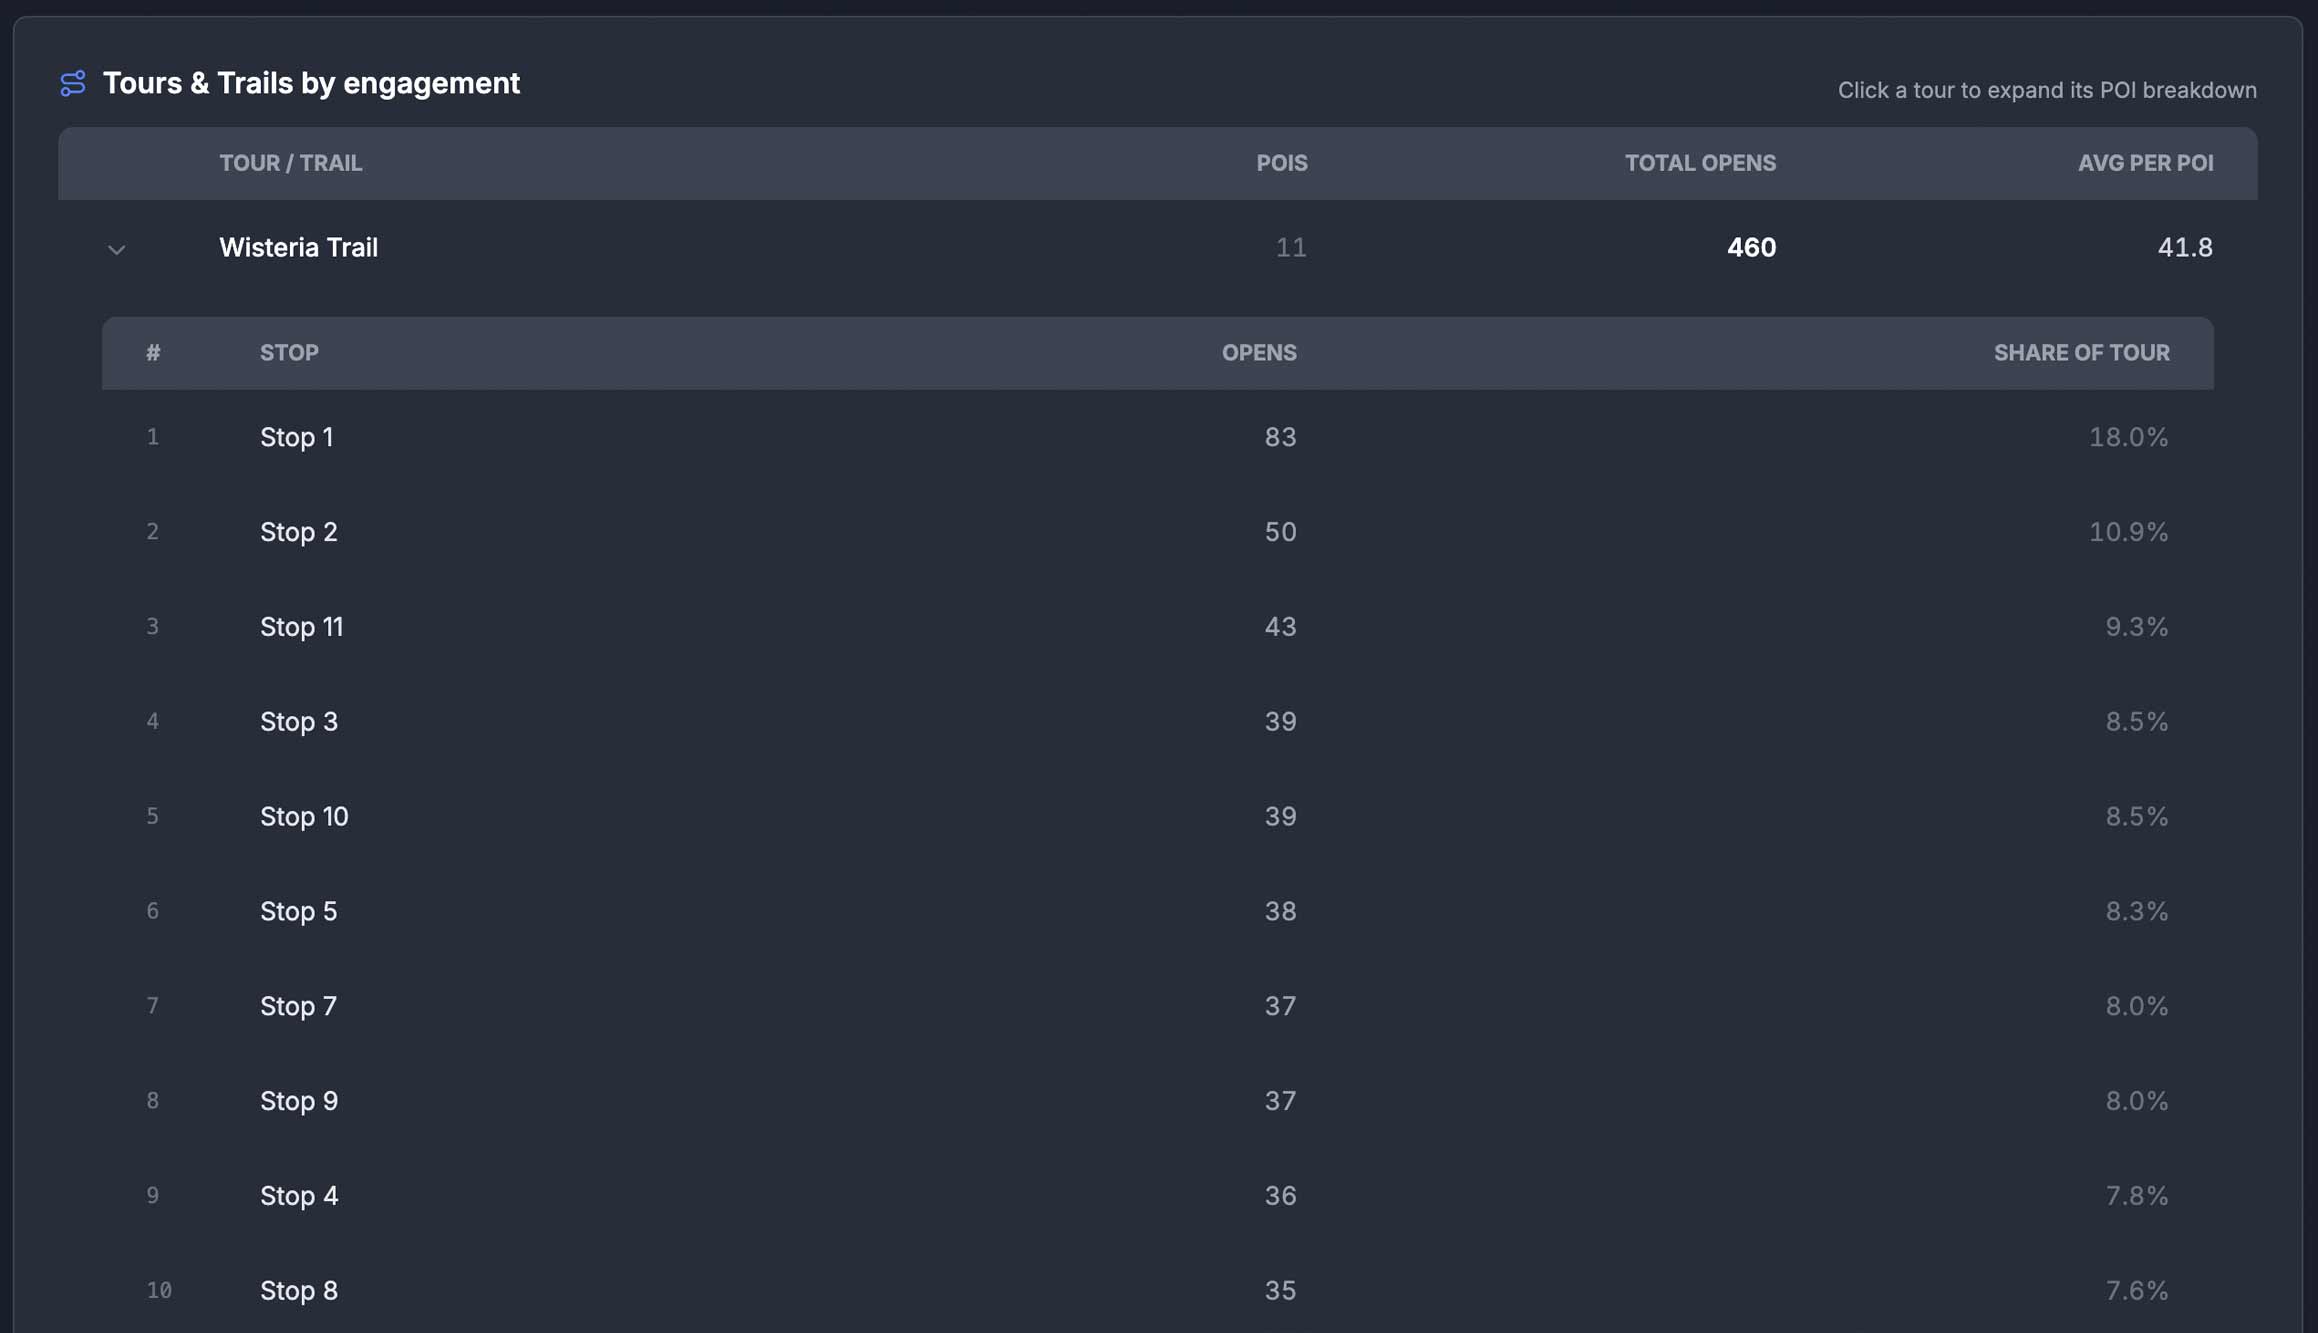
- →POI-level engagement data for every interpretive node - opens, dwell, media plays, completions
- →Sequencing data - the actual order in which visitors encounter your content
- →Comparative engagement across content formats - text, image, audio, video, 360°
Decisions this improves
- ★Which interpretive content to expand, redesign, or retire - based on engagement evidence
- ★Where to invest in richer formats - audio, video, immersive - based on existing engagement patterns
- ★How to structure narrative routes and trails - aligned with how visitors actually move through the story
Department 06
Senior Leadership
Owns destination-level strategy, board reporting, and cross-departmental alignment.
What you can't see
- ·Destination performance at a portfolio or estate level - comparable, consistent, exportable
- ·The link between digital strategy and physical performance - measured, not narrated
- ·How your destination compares to peer benchmarks on engagement, conversion, and visitor flow
HypaMaps provides
- →Cross-department dashboards rolling up Marketing, Operations, Commercial, and Interpretation signal
- →Investor and board-grade reporting - with year-on-year, season-on-season, property-on-property views
- →Multi-property benchmarking for groups, chains, and portfolios
Decisions this improves
- ★Where to focus strategic attention across your portfolio - backed by behavioural signal, not anecdote
- ★How to make the case to owners and boards for digital and capital investment
- ★Which department's hypothesis is supported by data - and which needs revisiting
Don't see your role above? The data still applies.
HypaMaps generates a single behavioural feed for your destination. Different roles, different teams, different decisions - they all pull from the same data, in the views that suit them. Talk to us about how the platform fits into your specific function.
Tell us your role on the demo form, and we'll show you the dashboard you'd actually use.