


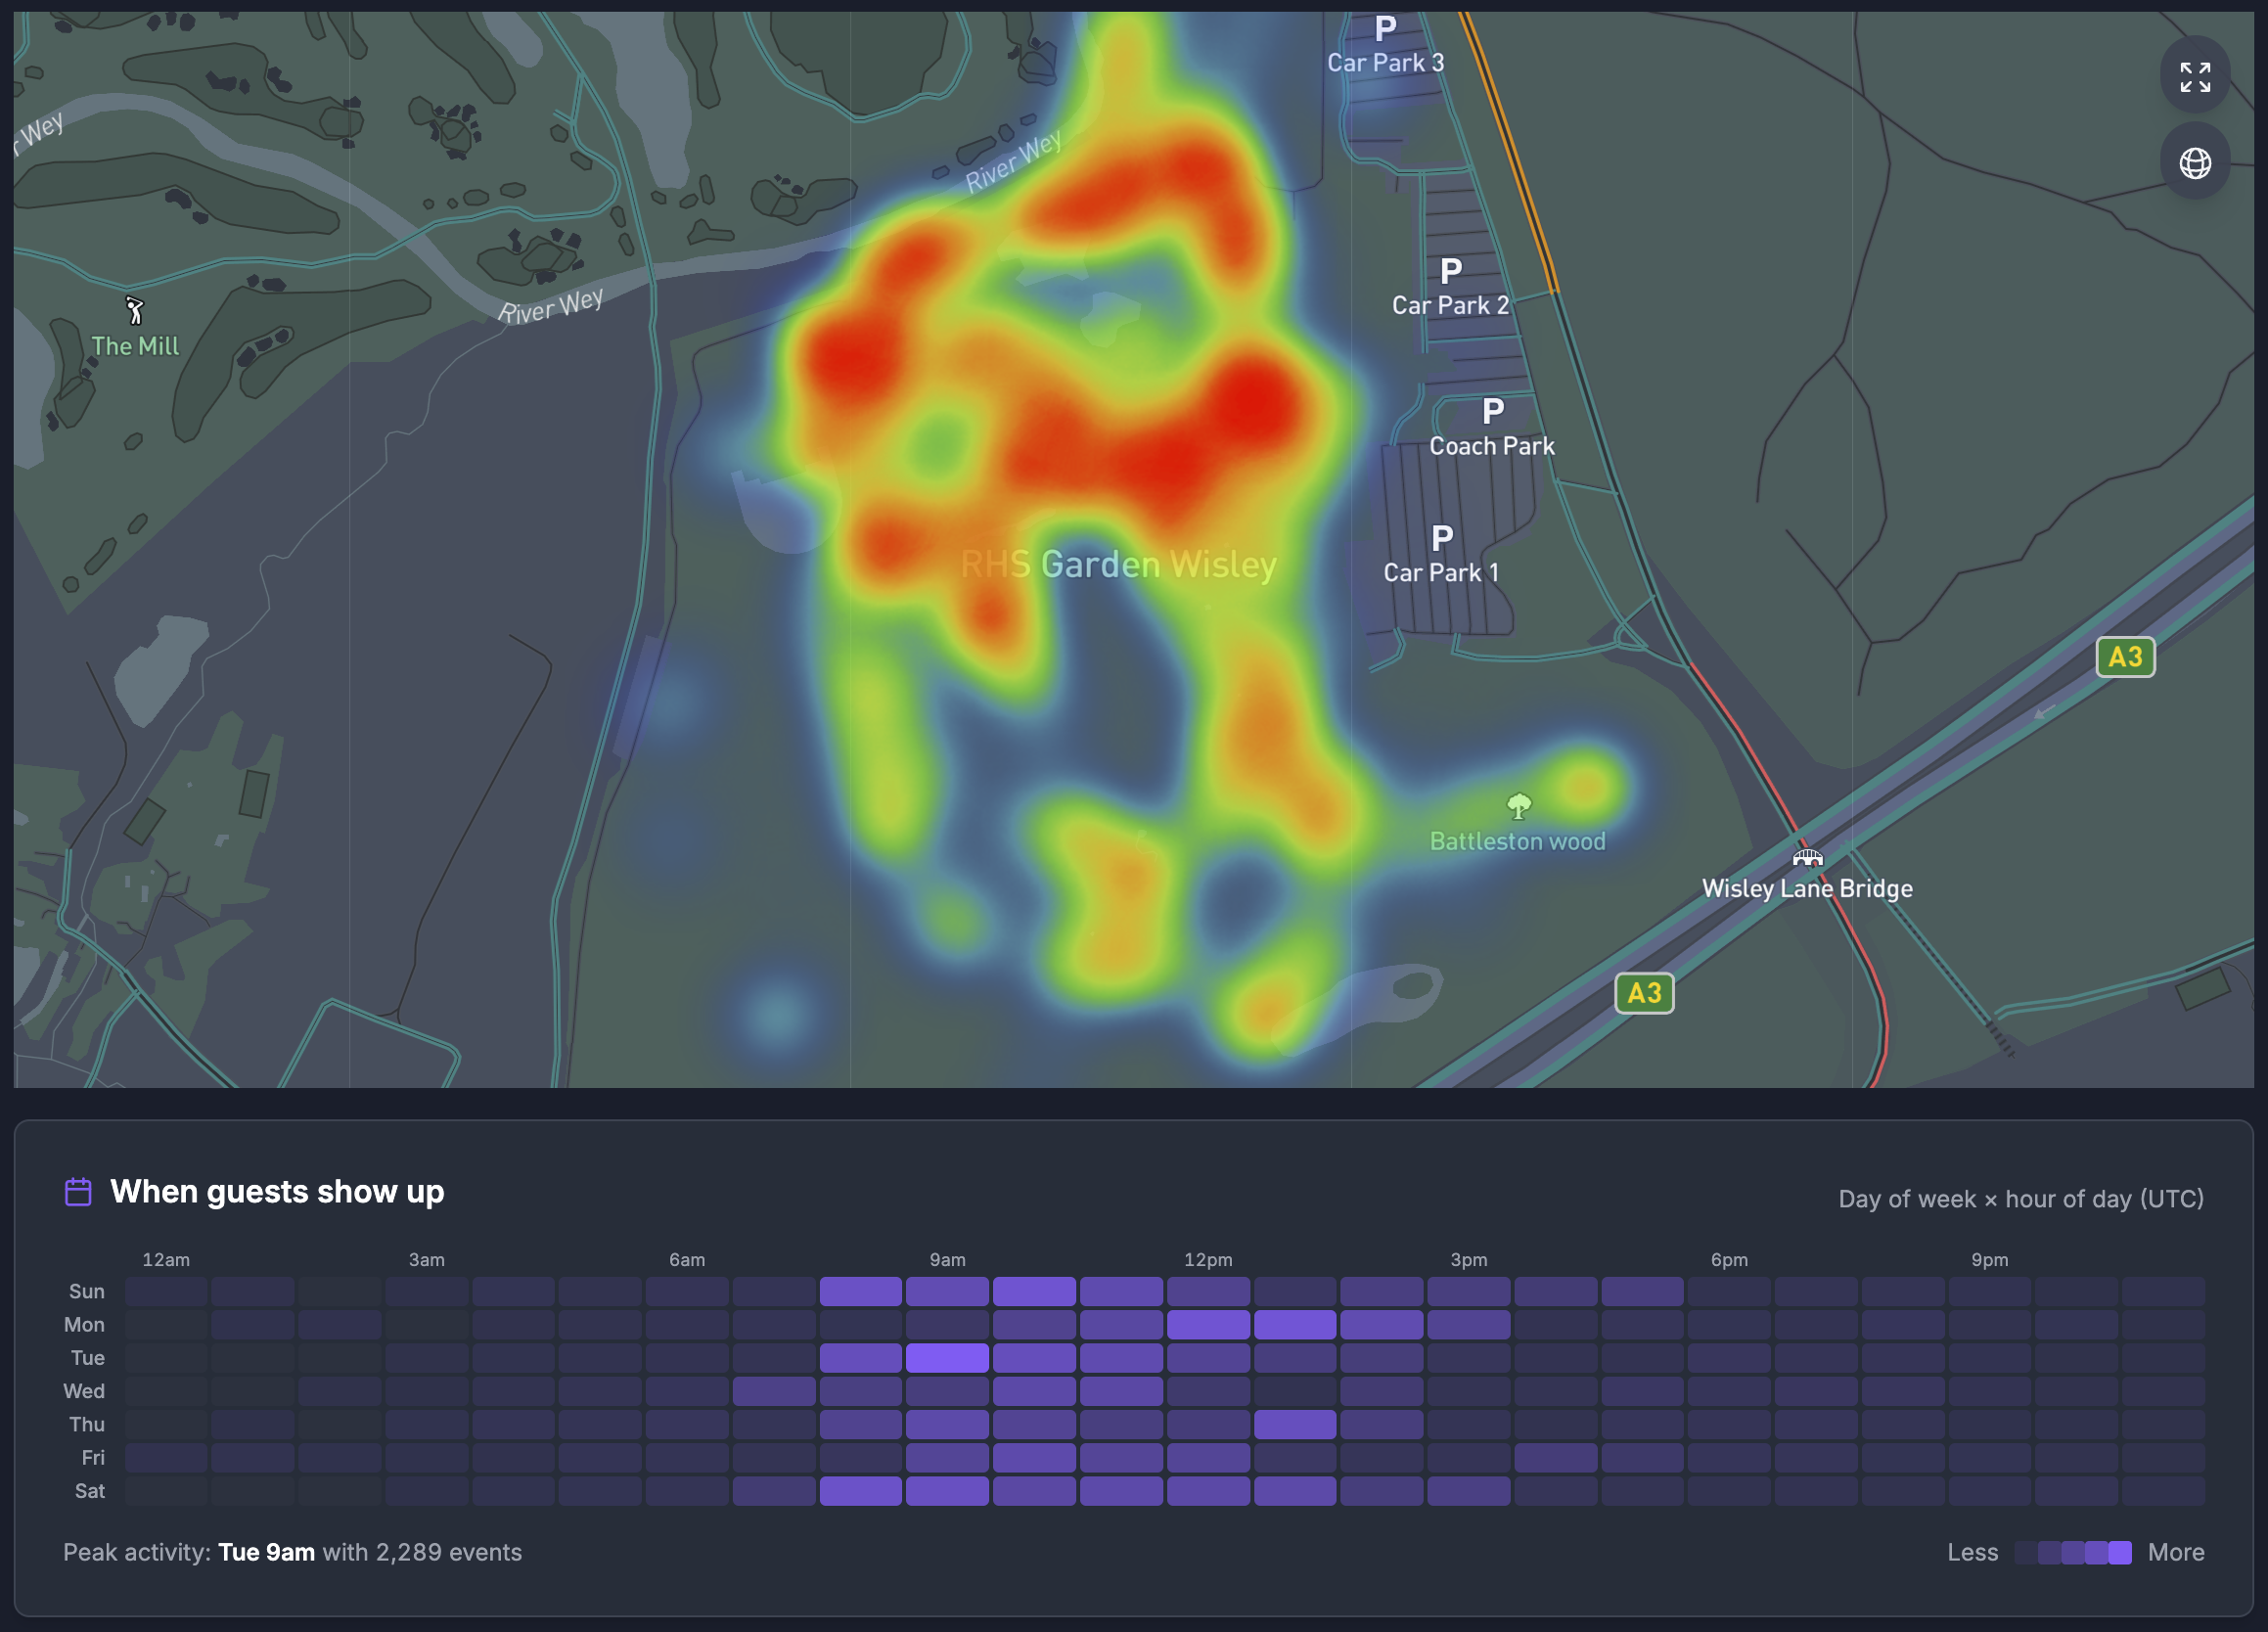
Movement & dwell
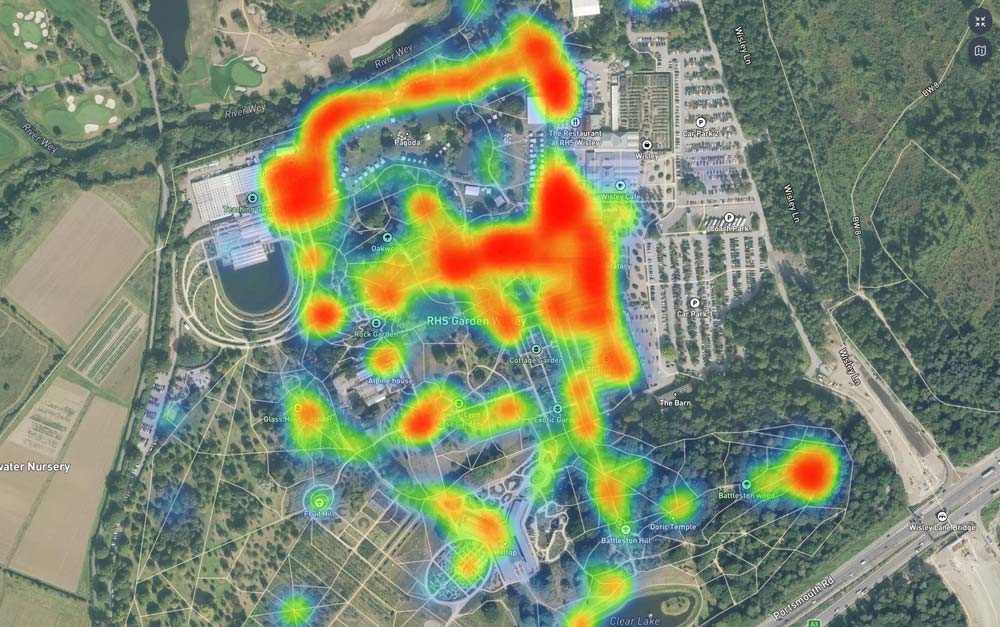
See exactly where guests congregate, where they pass through, and where they linger; by hour, by day, by zone.
Next-generation destination intelligence
Understand how your guests move, engage, and spend before they arrive, during their stay, and after they leave.
A photorealistic interactive 3D map engineered to put behavioural intelligence in your hands.

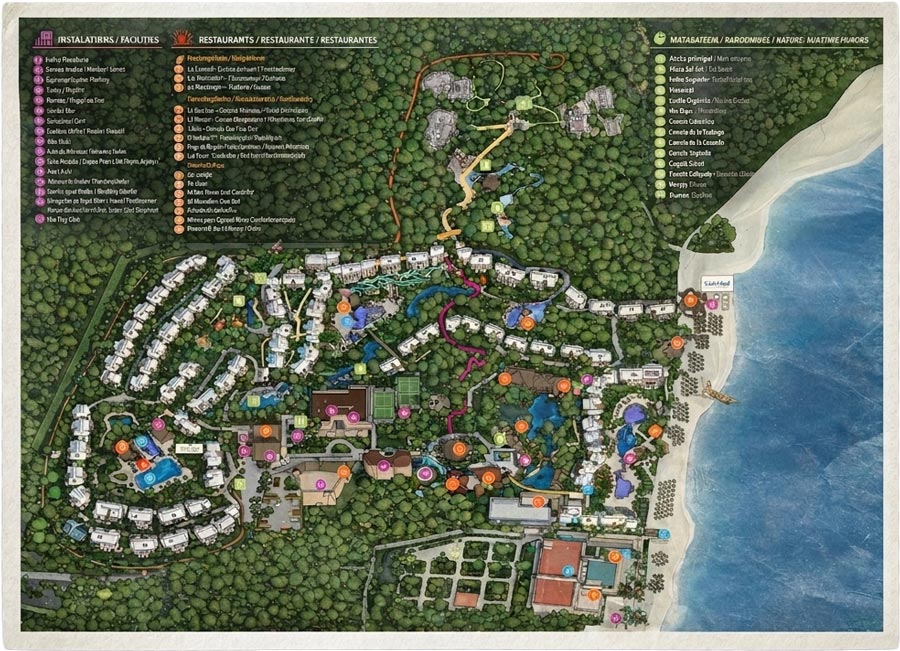
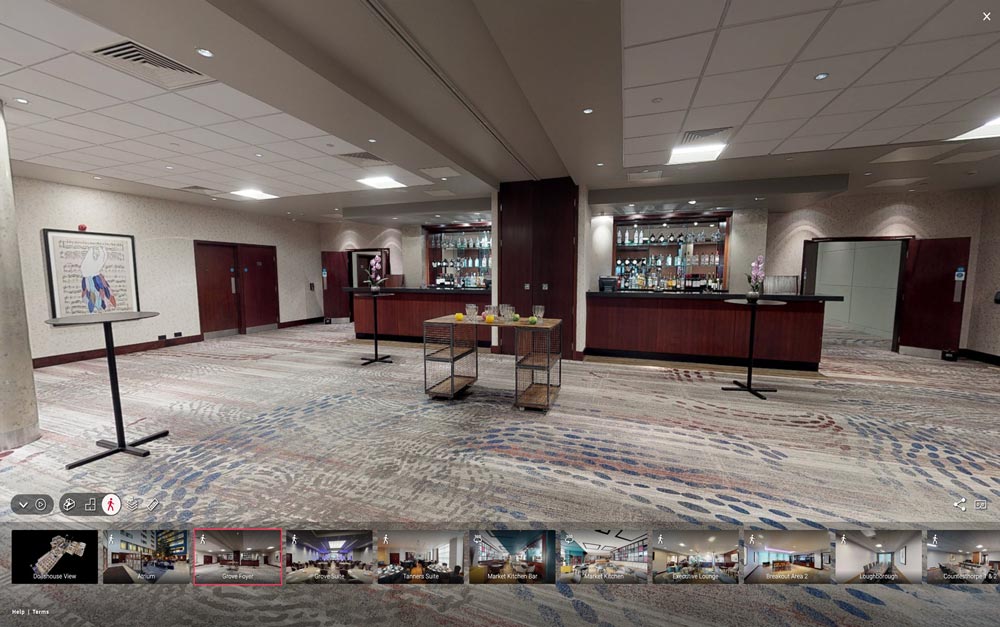
A static map shows your destination. A virtual tour shows your photos. Neither shows you what your guests choose, ignore, or come back to.
HypaMaps is different. The interactive 3D map is the interface. The behavioural data layer underneath is the product.
shows the property
shows the photos
HypaMaps shows the behaviour
For your guests
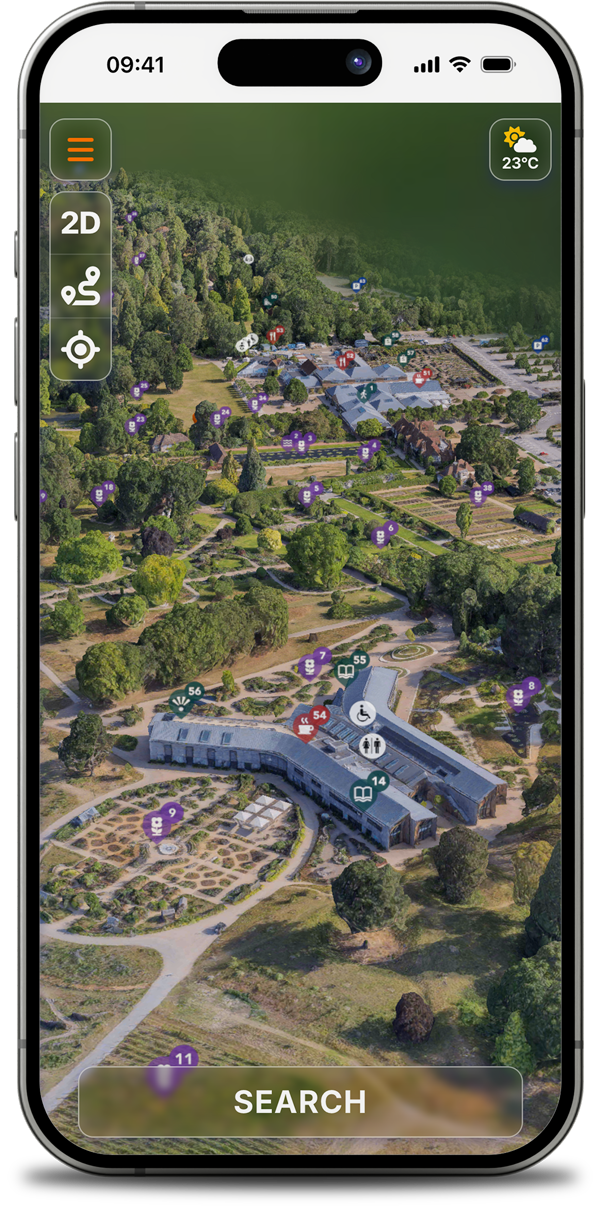
The whole property at a glance. Photorealistic, searchable, contextual. Every building, amenity, and POI, visible before guests arrive.
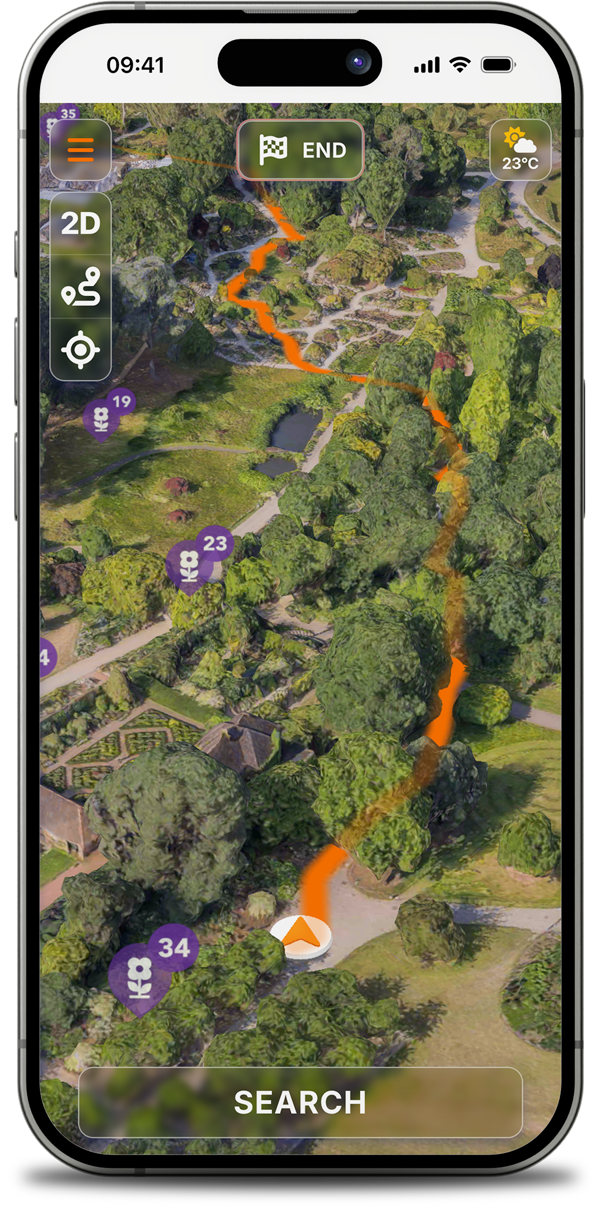
Real-time accurate wayfinding indoors and out. GPS-locked, accessibility-aware. Every venue, amenity, and experience one tap away.
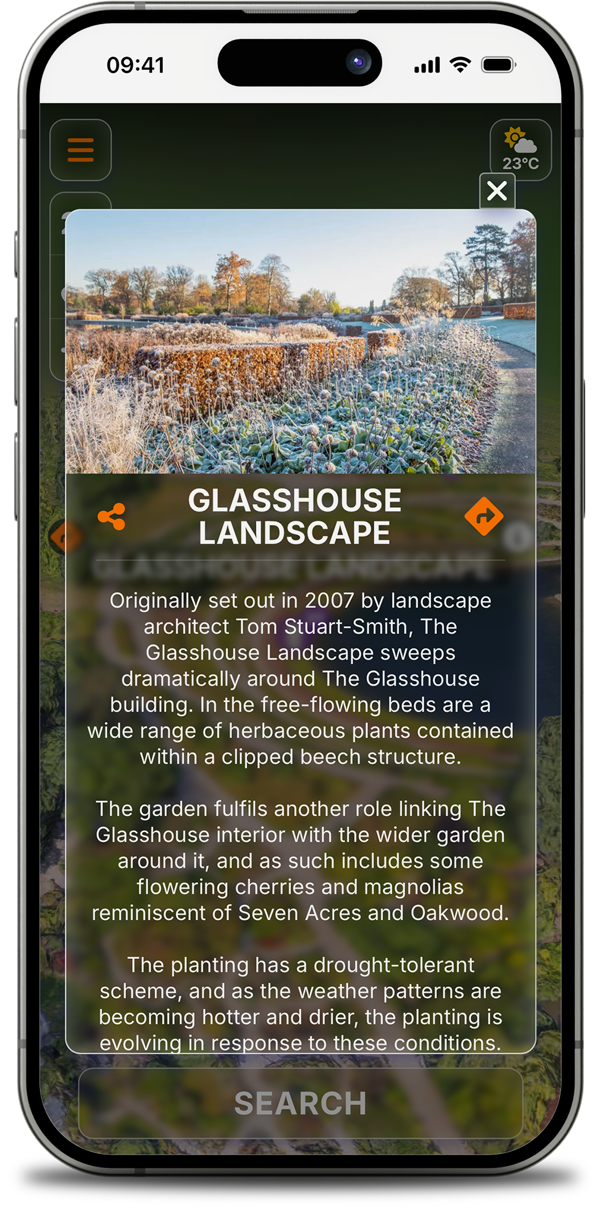
Photos, descriptions, opening times, booking links. Tap any place for the full story. Everything they need, exactly when they need it.
For your operation
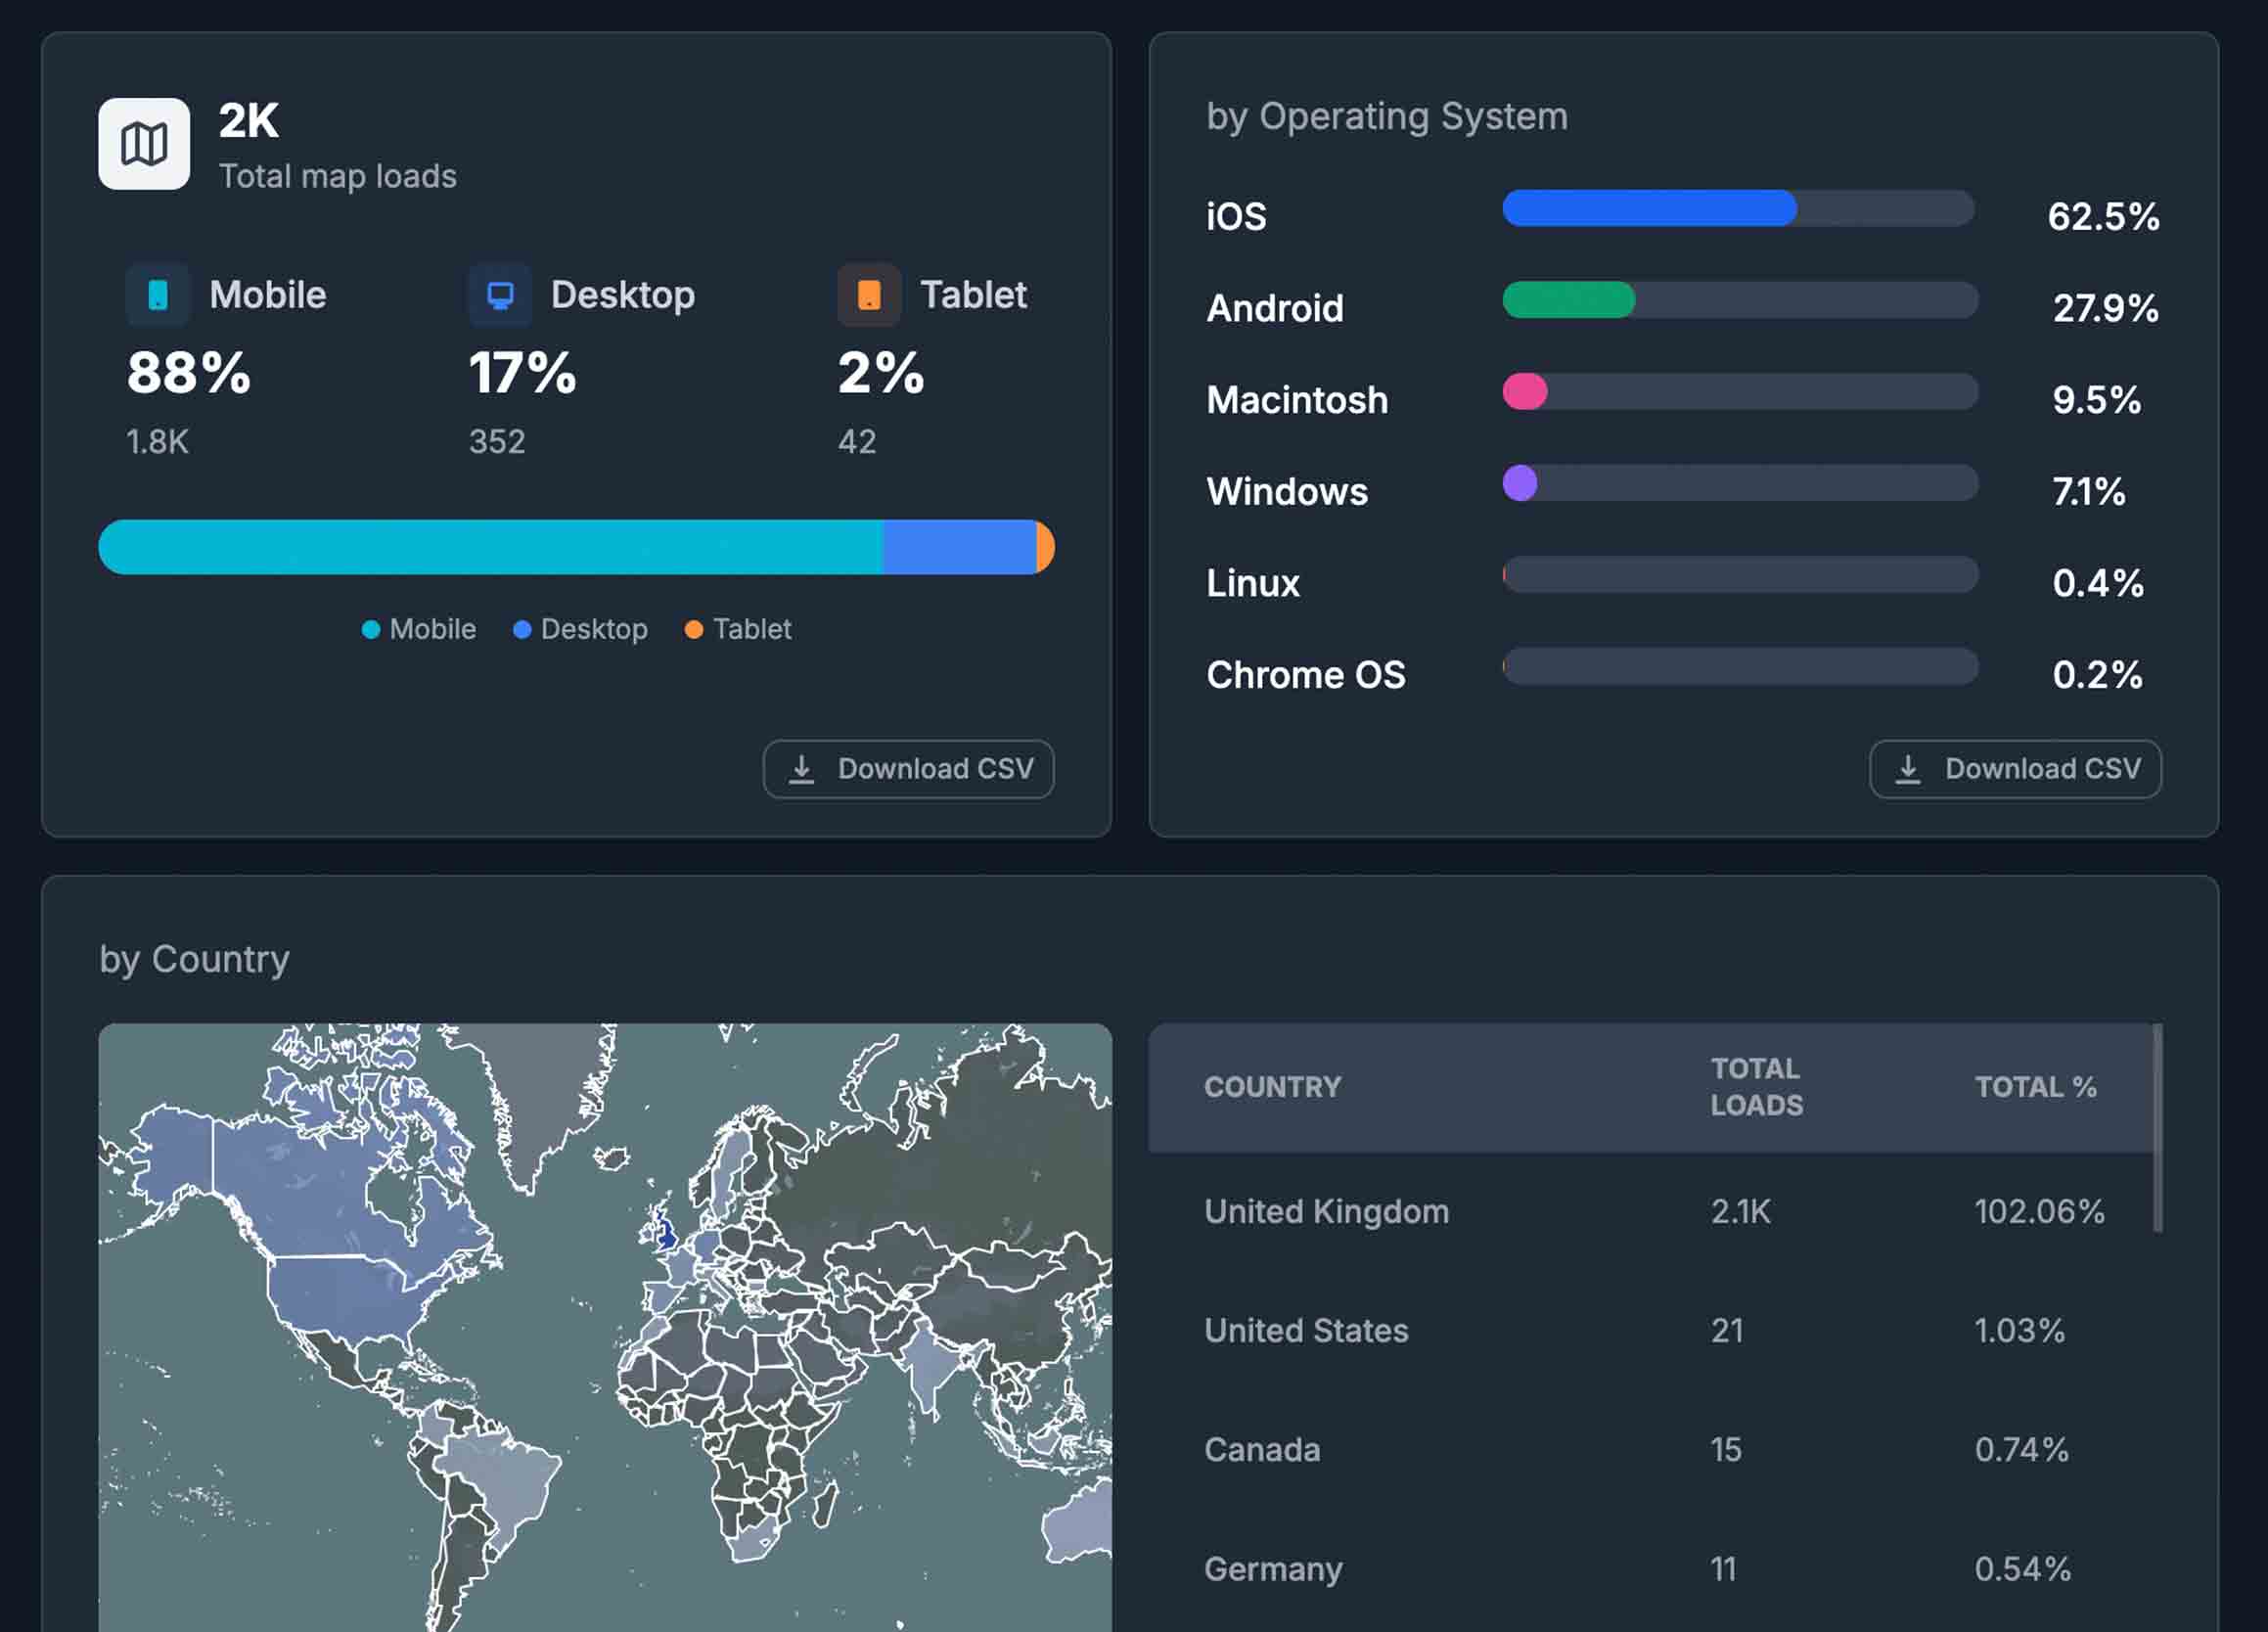
Each interaction your guests have inside HypaMaps generates structured behavioural data, turning your destination into a continuously measurable asset.
See exactly where guests congregate, where they pass through, and where they linger; by hour, by day, by zone.
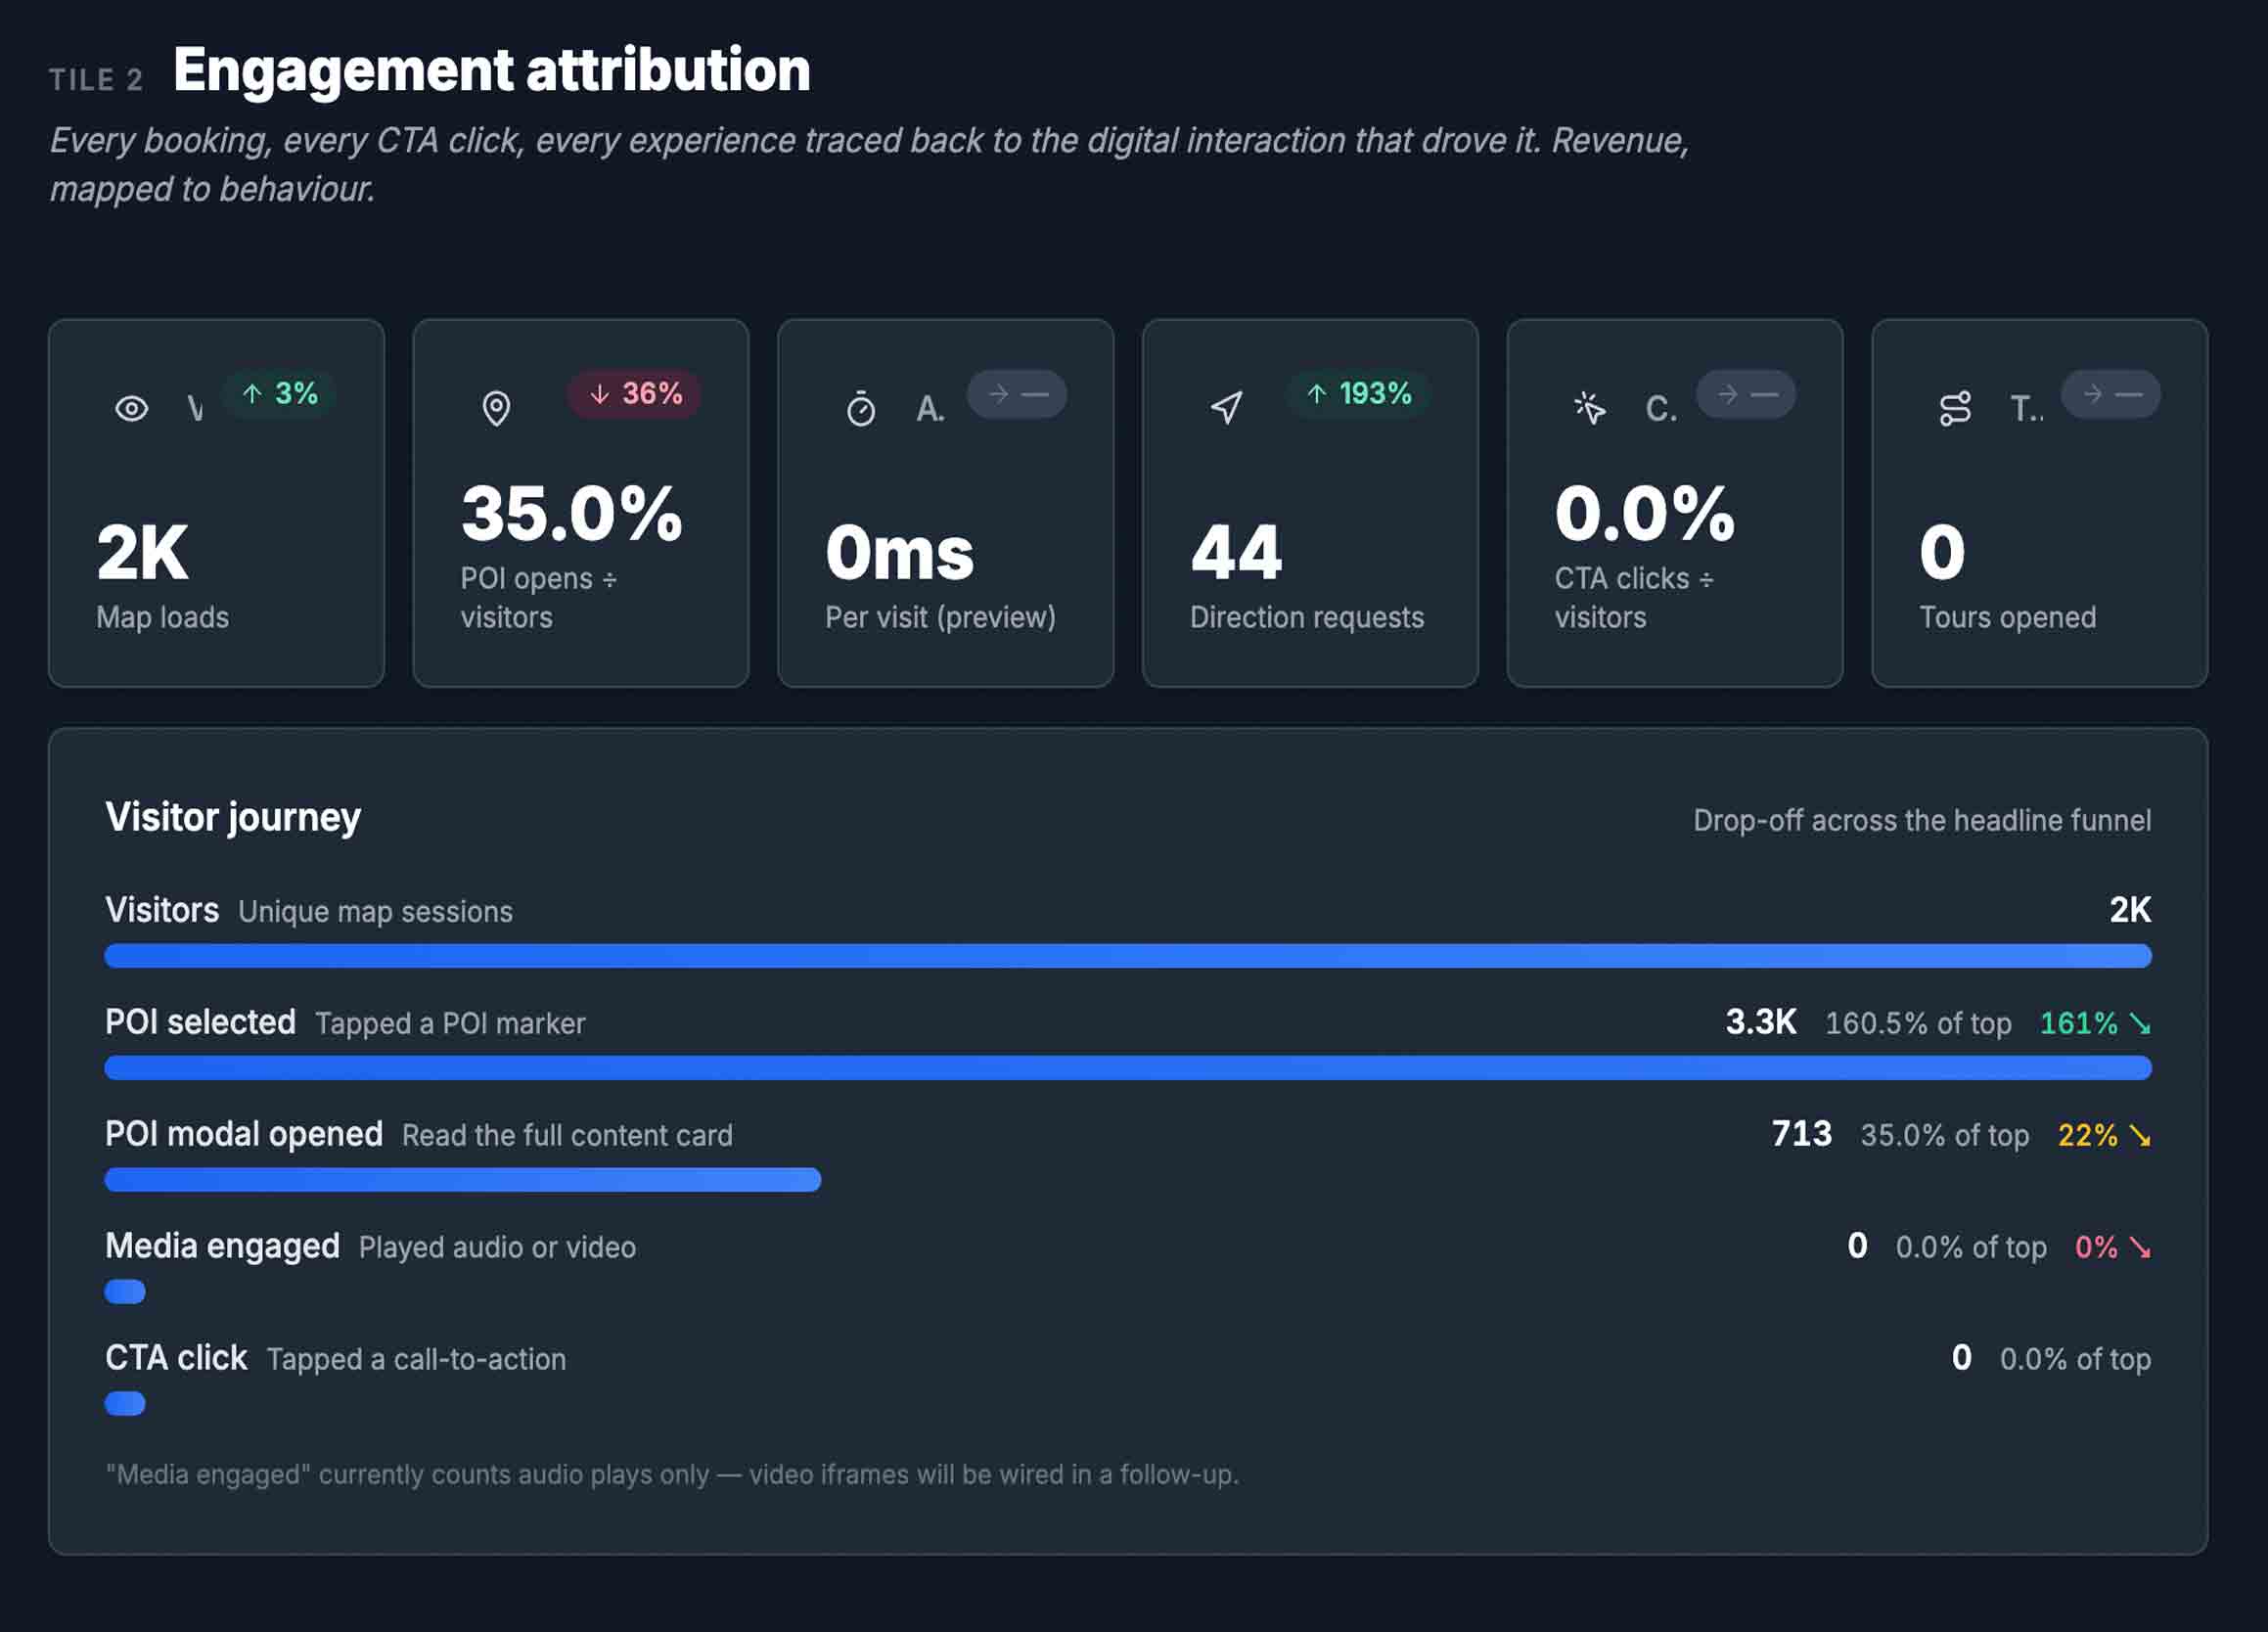
Every booking, every CTA click, every experience traced back to the digital interaction that drove it. Revenue, mapped to behaviour.
Congestion points, drop-off zones, under-used assets; surfaced as data, not anecdote. Brief your teams on what's actually happening.
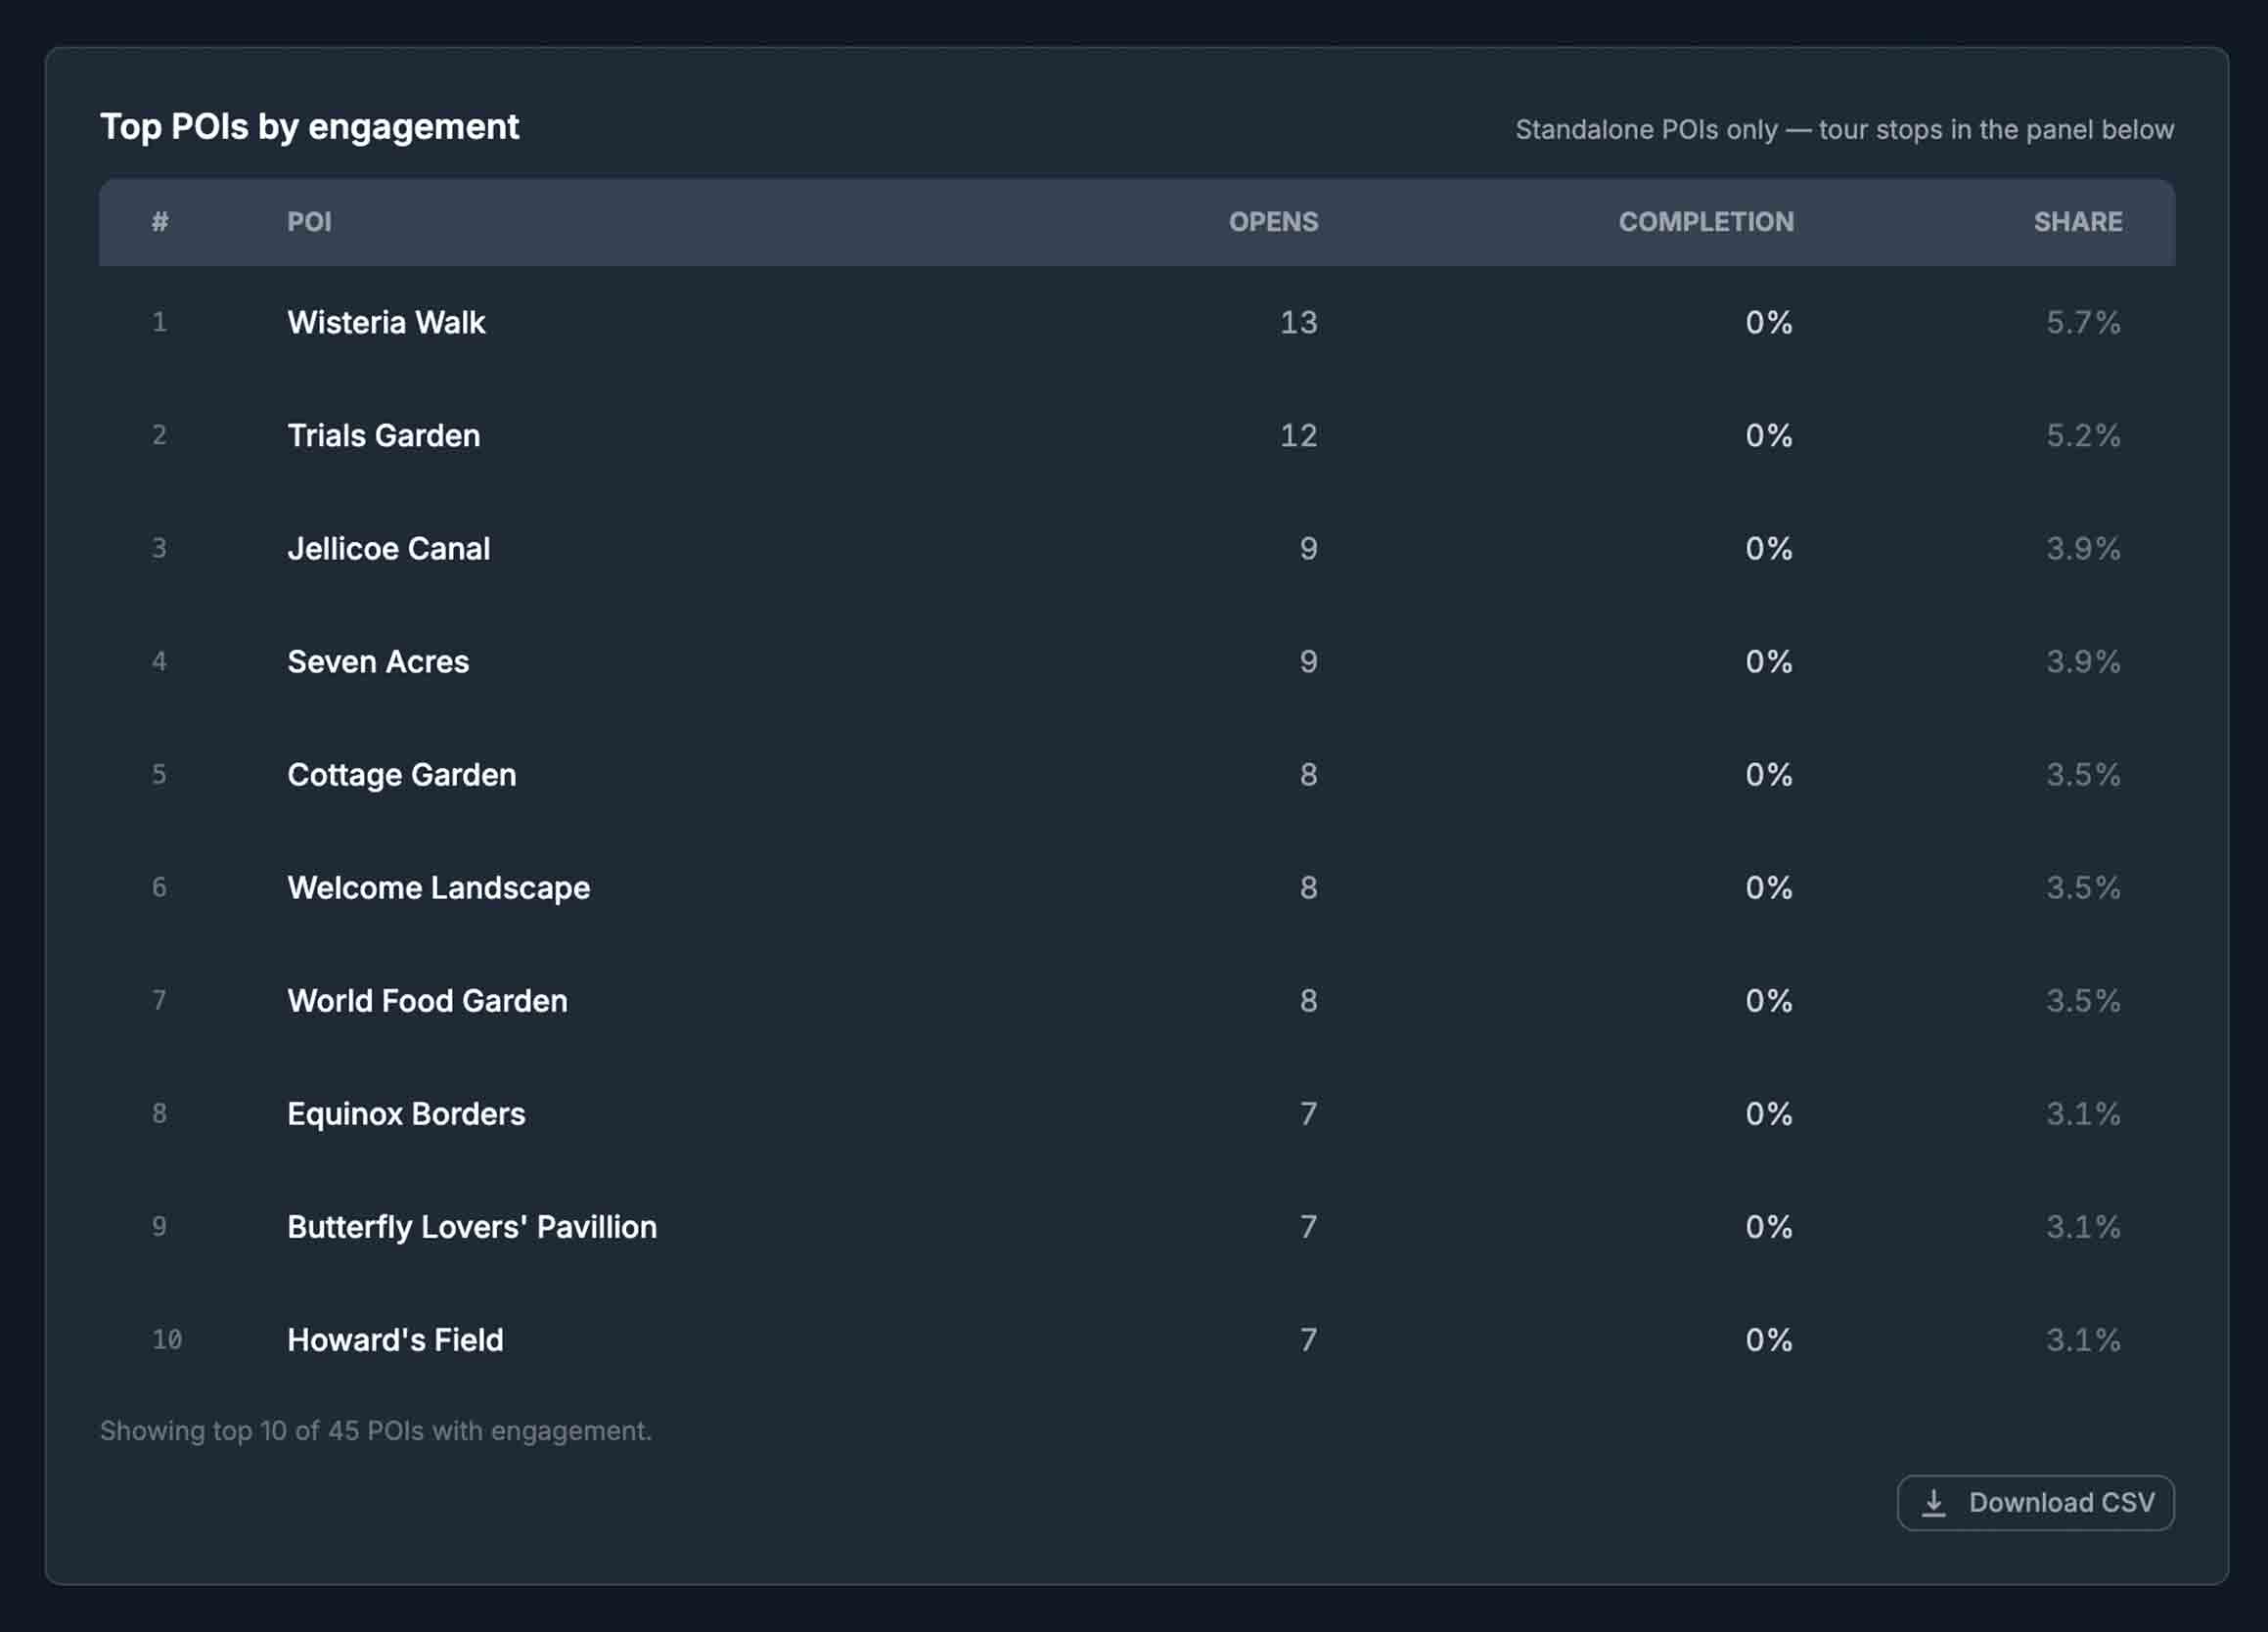
Which experiences your guests actually care about, which campaigns convert, which POIs earn attention. Decisions, not impressions.
Platform
Five stages, one pipeline. Every destination captured once, built, delivered, and continuously measured with data flowing back into the decisions every department needs to make.
Capture
aerial · precise · georeferenced
Build
photorealistic · 3D · semantic
Deliver
interactive · embeded · cms
Measure
engagement · dwell · attribution
Decide
marketing · sales · operations
By department
HypaMaps gives every department a measurable share of the platform's value.
Marketing
Attribute on-property revenue to digital engagement.
Operations
Brief teams on actual footfall, not last year's averages.
Commercial
See which experiences drive bookings and which burn attention.
Guest Experience
Map pain points before guests have to report them.
Interpretation
Track which stories guests engage with and which they walk past.
Leadership
Destination-level reporting your owners and board can act on.
Your turn
Twenty minutes is all it takes to get a clear picture of what data your team would have, and what your destination could look like powered by HypaMaps.